“…startling data omission that he told me: “eclipses even the so-called climategate event.”Could these lies of omission and commission by NOAA scientists be the beginning of the end of "Acidification-gate"?
Touchy Feely Science – one chart suggests there’s a ‘pHraud’ in omitting Ocean Acidification data in Congressional testimony
Willis Eschenbach tips me to a story by Marita Noon, titled:
What if Obama’s climate change policies are based on pHraud?
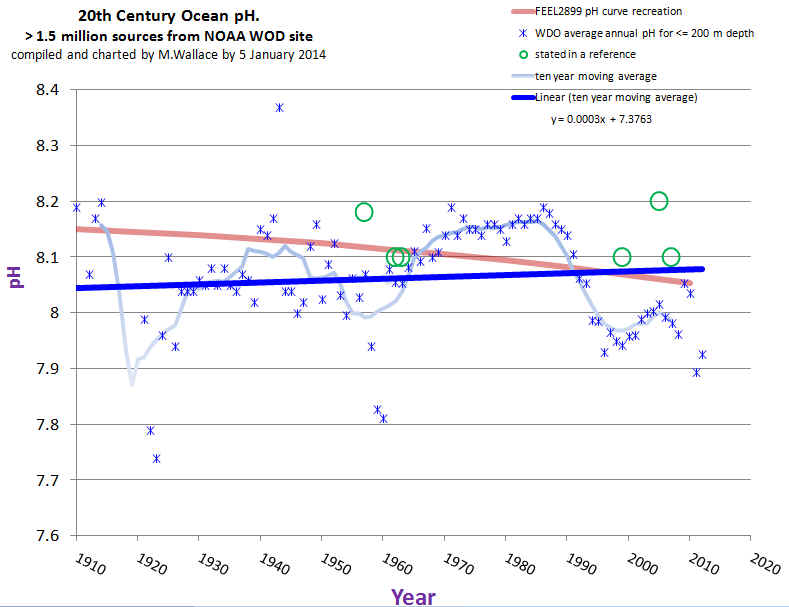
I’ve reproduced portions of it here, with a link to the full article. The graph with ALL the data is compelling.
“Ocean acidification” (OA) is receiving growing attention. While someone who doesn’t follow climate change science might think OA is a stomach condition resulting from eating bad seafood, OA is claimed to be a phenomenon that will destroy ocean life—all due to mankind’s use of fossil fuels. It is a foundational theory upon which the global warming/climate change narrative is built.
The science and engineering website Quest, recently posted: “Since the Industrial Revolution in the late 1700s, we have been mining and burning coal, oil and natural gas for energy and transportation. These processes release carbon dioxide (CO2) into the atmosphere. It is well established that the rising level of CO2 in our atmosphere is a major cause of global warming. However, the increase in CO2 is also causing changes to the chemistry of the ocean. The ocean absorbs some of the excess atmospheric CO2, which causes what scientists call ocean acidification. And ocean acidification could have major impacts on marine life.”
Within the Quest text is a link to a chart by Dr. Richard A. Feely, who is a senior scientist with the Pacific Marine Environmental Laboratory (PMEL)—which is part of the National Oceanic and Atmospheric Administration (NOAA). Feely’s climate-crisis views are widely used to support the narrative.

Feely’s four-page report: Carbon Dioxide and Our Ocean Legacy, offered on the NOAA website, contains a similar chart. This chart, titled “Historical & Projected pH & Dissolved Co2,” begins at 1850. Feely testified before Congress in 2010—using the same data that shows a decline in seawater pH (making it more acidic) that appears to coincide with increasing atmospheric carbon dioxide.
…
The December edition of the scientific journal Nature Climate Change features commentary titled: “Lessons learned from ocean acidification research.”
However, an inquisitive graduate student presented me with a very different “lesson” on OA research.
Mike Wallace is a hydrologist with nearly 30 years’ experience, who is now working on his Ph.D. in nanogeosciences at the University of New Mexico. In the course of his studies, he uncovered a startling data omission that he told me: “eclipses even the so-called climategate event.” Feely’s work is based on computer models that don’t line up with real-world data—which Feely acknowledged in email communications with Wallace (which I have read). And, as Wallace determined, there is real world data. Feely, and his coauthor Dr. Christopher L. Sabine, PMEL Director, omitted 80 years of data, which incorporate more than 2 million records of ocean pH levels.
Feely’s chart, first mentioned, begins in 1988—which is surprising as instrumental ocean pH data has been measured for more than 100 years since the invention of the glass electrode pH (GEPH) meter. As a hydrologist, Wallace was aware of GEPH’s history and found it odd that the Feely/Sabine work omitted it. He went to the source. The NOAA paper with the chart beginning in 1850 lists Dave Bard, with Pew Charitable Trust, as the contact.
Wallace sent Bard an email: “I’m looking in fact for the source references for the red curve in their plot which was labeled ‘Historical & Projected pH & Dissolved Co2.’ This plot is at the top of the second page. It covers the period of my interest.” Bard responded and suggested that Wallace communicate with Feely and Sabine—which he did over a period of several months. Wallace asked again for the “time series data (NOT MODELING) of ocean pH for 20th century.” Sabine responded by saying that it was inappropriate for Wallace to question their “motives or quality of our science,” adding that if he continued in this manner, “you will not last long in your career.” He then included a few links to websites that Wallace, after spending hours reviewing them, called “blind alleys.” Sabine concludes the email with: “I hope you will refrain from contacting me again.” But communications did continue for several more exchanges.
In an effort to obtain access to the records Feely/Sabine didn’t want to provide, Wallace filed a Freedom of Information Act (FOIA) request.
In a May 25, 2013 email, Wallace offers some statements, which he asks Feely/Sabine to confirm:
“…it is possible that Dr. Sabine WAS partially responsive to my request. That could only be possible however, if only data from 1989 and later was used to develop the 20th century portion of the subject curve.”
“…it’s possible that Dr. Feely also WAS partially responsive to my request. Yet again, this could not be possible unless the measurement data used to define 20th century ocean pH for their curve, came exclusively from 1989 and later (thereby omitting 80 previous years of ocean pH 20th century measurement data, which is the very data I’m hoping to find).”
Sabine writes: “Your statements in italics are essentially correct.” He adds: “The rest of the curve you are trying to reproduce is from a modeling study that Dr. Feely has already provided and referenced in the publication.”
In his last email exchange, Wallace offers to close out the FOIA because the email string “clarified that your subject paper (and especially the ‘History’ segment of the associated time series pH curve) did not rely upon either data or other contemporary representations for global ocean pH over the period of time between the first decade of 1900 (when the pH metric was first devised, and ocean pH values likely were first instrumentally measured and recorded) through and up to just before 1988.” Wallace received no reply, but the FOIA was closed in July 2013 with a “no document found” response.
Interestingly, in this same general timeframe, NOAA reissued its World Ocean Database. Wallace was then able to extract the instrumental records he sought and turned the GEPH data into a meaningful time series chart, which reveals that the oceans are not acidifying. (For another day, Wallace found that the levels coincide with the Pacific Decadal Oscillation.) As Wallace emphasized: “there is no global acidification trend.”

Regarding the chart in question, Wallace concludes: “Ocean acidification may seem like a minor issue to some, but besides being wrong, it is a crucial leg to the entire narrative of ‘human-influenced climate change.’ By urging our leaders in science and policy to finally disclose and correct these omissions, you will be helping to bring honesty, transparency, and accountability back where it is most sorely needed.”
“In whose professional world,” Wallace asks, “is it acceptable to omit the majority of the data and also to not disclose the omission to any other soul or Congressional body?”
Full story here: http://energymakesamericagreat.org/current-energy-commentary
There’s a petition: http://www.ipetitions.com/petition/restore-the-worlds-ocean-ph-measurements
Albert Einstein once said: “The right to search for truth implies also a duty; one must not conceal any part of what one has recognized to be true.”
ReplyDeleteAnother significant data point in the pattern of lies.
ReplyDeleteI don't understand ocean acidification but I do understand that CO2 in the oceans is held at 50 times the amount in the atmosphere. I find it difficult to follow the ocean pH decrease for the small rise in atmospheric volume. We must be releasing a hell of a lot more CO2 than they claim by just atmospheric measurements. Or maybe it is pHraud.
ReplyDeleteI totally agree with the idea that such studies made on computer based models may not be correct. It's much more important, in my oppinion, to analyse the real facts and the historical datas (as much as they exist) in order to come up with a proper scientific conclusion.
ReplyDeleteAs for the CO2 emissions and the ocean acidification, the way I see it, it's not like we can do much to change current situation. But we can do much to evoid future climate changes of such gravity.
History shows us that in the past century, there have been other climate changes, that seem to be linked to certain events that affected the oceans in the same period. Naval wars, as small as they seem compared to the vaste spread of the oceans, are some of the more importants causes of the climate changes in the history.
"It is well established that the rising level of CO2 in our atmosphere is a major cause of global warming." That is not true. There is no evidence in the paleoclimate record that CO2 has any effect on climate. Changes in CO2 do not effect changes in the lapse rate, the temperature profile of the atmosphere. For those who believe in the greenhouse effect, the primary greenhouse gas is H2O which provides ample negative feedbacks to changes in other greenhouse gases so as to mitigate any effect they might have on climate.
ReplyDeleteAgreed
Delete"Shells - Carbon Transport Down to the Deep
ReplyDeleteShell-building organisms such as coral, oysters, lobsters, pteropods, sea urchins, and some species of phytoplankton use calcium carbonate ions to build their shells, plates and inner skeletons. The carbon that is incorporated into the shells of these organisms can end up in deep ocean sediments as these organisms die and sink. Although some of the shells dissolve before reaching the seafloor sediments, shells slowly build up on the sea floor storing the carbon for millions of years.
Coccolithophores
Coccolithophores[reuse info] Phytoplankton bloom Key of Biscaye france
[reuse info] Coccolithophores perhaps have had the biggest impact on the carbon cycle over time. These microscopic phytoplankton remove carbonate ions and calcium ions from seawater to build their calcium carbonate (CaCO3) plates - called coccoliths. When there is plenty of sunlight and nutrients, these tiny phytoplankton will explosively reproduce, producing a "bloom" of trillions of coccolithophores floating in the surface of the ocean. Satellites can see these blooms from space, such as the very large bloom above that appeared off the coast of Norway in the Barents Sea. In just a few days, coccolithophores gobble up the available nutrients and start to die. The trillions of coccolith plates slowly sink down to the bottom of the ocean taking the calcium carbonate in their plates with them.
The calcium carbonate in these sediments are actually chalk - the same type of chalk used to write on blackboards. Sometimes slow tectonic movements will force these chalky sediments above sea level. The White Cliffs of Dover are in England are perhaps the best known example of this. To find out more, read about Coccolithophores and White Cliffs of Dover and then play the video "Chalk Dust."
http://serc.carleton.edu/eslabs/carbon/6a.html
"Riding the global cycles
ReplyDeleteDiatoms fix as much carbon dioxide as all the rainforests of the world combined, and they may very well have been the main architects of our current, moderately cool climate situation. The rise of the diatoms began in a much warmer climate than ours, with no ice caps on the poles. The atmospheric carbon dioxide concentration was much higher than today. In the Cretaceous, around 100 million years ago, when diatoms began to become widespread and developed great diversity, the carbon dioxide level was fivefold higher than today, and oxygen was lower. Remarkably, diatoms managed to thrive and expand during a period of extreme climate change, and they also seem to have come through the mass extinction that saw off the dinosaurs without too many problems. The opening of the Drake Passage around 40 million years ago, which created the continent of Antarctica, was particularly beneficial for the diatoms because they began to proliferate dramatically in the cold turbulent waters of the Southern Ocean.
As diatoms evolved thicker and denser cell walls and spread across the oceans, it became more likely that dead diatoms might sink to the ocean floor and thus sequester their carbon."
Sorry.
ReplyDeletehttp://www.sciencedirect.com/science/article/pii/S0960982212008664
All rain and all rivers that have flowed into the oceans for millions and millions of years have been acidic, often down to pH 5.6...
ReplyDeleteyet the oceans remain stubbornly around pH 8
This is because there is far greater equilibrium at play than the CO2 equilibrium.
The oceans have huge quantities of limestone and basalt around and below which provide the alkalinity of the oceans.
No tiny change in atmospheric CO2 levels is ever going to overcome this equilibrium.
The whole CO2 cause ocean "acidification" meme is a total furphy. !
AndyG55
Text written by Professor. Walter Jensen Chemol project and adapted Marlene
ReplyDeleteRau and Andrew Brown.
“Carbon dioxide (CO2 relative molecular weight: 44.01) is a colorless,
odorless and non-flammable gas. Its density is 1.977 g / l (at
0 ° C) and the melting point of -57 ° C (at a pressure of 5185 bar).
The solubility of carbon dioxide increases with the pressure of 100 parts of water
dissolved 171 parts of carbon dioxide at 0 ° C, 119 at 10 ° C, 88 at 20 ° C,
75.7 at 25 ° C and 27 at 60 ° C. For example, 1 liter of CO2 dissolved in 1 liter of water (in
room temperature) at a pressure of 1 bar (normal pressure
air); 2 liters of CO2 at 2 bars; 3 l at 3 bar, and in 4 l at 4 bar. solution
water is slightly acidic because 0.1% of dissolved carbon dioxide molecules
reacts with water.
“Period of stabilization of the magnetic activity Sun.
ReplyDeleteStabilization period earthly pole position.
Descending upwelling in the ocean causing a decline in their photosynthesis and warming seawater
Reducing CO2 solubility in seawater as a result of heating surface ocean waters, reducing the absorption of CO2 in the process of photosynthesis, increase the content of CO2 gas in the surface waters of the sea due to the increased acidity, decrease absorption of CO2 from the atmosphere and gradually increasing the concentration of CO2 in the atmosphere by diffusion of excess CO2 from seawater into the atmosphere to a level of 300 ppmv over the duration of about 20 000 years Earth’s poles traffic loss and the consequent warming ocean waters about 12 ° C and warming the Earth about 12 ° C.”
http://pmel.noaa.gov/co2/story/Quality+of+pH+Measurements+in+the+NODC+Data+Archives
ReplyDelete"While seawater pH measurements have been made on some oceanographic expeditions starting with the first measurements that were made by Sørensen and Palitzsch (1910), most of the earlier data have proven to be problematic for a number of reasons... In addition, there is the added problem of data sparseness in any given year for the earlier data sets, which makes the determination of a global annual mean value for a particular time period to be quite challenging, necessarily increasing its likely uncertainty.