Tuesday, December 23, 2014

Acidification-gate?: NOAA accused of 'pHraud' by hiding data showing oceans have not "acidified" over past century


Reposted from Watts Up With That, NOAA scientists have "fraudulently" hidden ocean pH data showing no evidence of ocean acidification over the past 104 years, a

“…startling data omission that he told me: “eclipses even the so-called climategate event.”
Could these lies of omission and commission by NOAA scientists be the beginning of the end of "Acidification-gate"?


Prior posts on ocean "acidification," including why a warming ocean will not "acidify" due to increased outgassing of CO2 with temperature.


Touchy Feely Science – one chart suggests there’s a ‘pHraud’ in omitting Ocean Acidification data in Congressional testimony


Willis Eschenbach tips me to a story by Marita Noon, titled:
What if Obama’s climate change policies are based on pHraud?
I’ve reproduced portions of it here, with a link to the full article. The graph with ALL the data is compelling.


“Ocean acidification” (OA) is receiving growing attention. While someone who doesn’t follow climate change science might think OA is a stomach condition resulting from eating bad seafood, OA is claimed to be a phenomenon that will destroy ocean life—all due to mankind’s use of fossil fuels. It is a foundational theory upon which the global warming/climate change narrative is built.
The science and engineering website Quest, recently posted: “Since the Industrial Revolution in the late 1700s, we have been mining and burning coal, oil and natural gas for energy and transportation. These processes release carbon dioxide (CO2) into the atmosphere. It is well established that the rising level of CO2 in our atmosphere is a major cause of global warming. However, the increase in CO2 is also causing changes to the chemistry of the ocean. The ocean absorbs some of the excess atmospheric CO2, which causes what scientists call ocean acidification. And ocean acidification could have major impacts on marine life.”
Within the Quest text is a link to a chart by Dr. Richard A. Feely, who is a senior scientist with the Pacific Marine Environmental Laboratory (PMEL)—which is part of the National Oceanic and Atmospheric Administration (NOAA). Feely’s climate-crisis views are widely used to support the narrative.
hitimeseries2_med
Feely’s four-page report: Carbon Dioxide and Our Ocean Legacy, offered on the NOAA website, contains a similar chart. This chart, titled “Historical & Projected pH & Dissolved Co2,” begins at 1850. Feely testified before Congress in 2010—using the same data that shows a decline in seawater pH (making it more acidic) that appears to coincide with increasing atmospheric carbon dioxide.
The December edition of the scientific journal Nature Climate Change features commentary titled: “Lessons learned from ocean acidification research.”
However, an inquisitive graduate student presented me with a very different “lesson” on OA research.
Mike Wallace is a hydrologist with nearly 30 years’ experience, who is now working on his Ph.D. in nanogeosciences at the University of New Mexico. In the course of his studies, he uncovered a startling data omission that he told me: “eclipses even the so-called climategate event.” Feely’s work is based on computer models that don’t line up with real-world data—which Feely acknowledged in email communications with Wallace (which I have read). And, as Wallace determined, there is real world data. Feely, and his coauthor Dr. Christopher L. Sabine, PMEL Director, omitted 80 years of data, which incorporate more than 2 million records of ocean pH levels.
Feely’s chart, first mentioned, begins in 1988—which is surprising as instrumental ocean pH data has been measured for more than 100 years since the invention of the glass electrode pH (GEPH) meter. As a hydrologist, Wallace was aware of GEPH’s history and found it odd that the Feely/Sabine work omitted it. He went to the source. The NOAA paper with the chart beginning in 1850 lists Dave Bard, with Pew Charitable Trust, as the contact.
Wallace sent Bard an email: “I’m looking in fact for the source references for the red curve in their plot which was labeled ‘Historical & Projected pH & Dissolved Co2.’ This plot is at the top of the second page. It covers the period of my interest.” Bard responded and suggested that Wallace communicate with Feely and Sabine—which he did over a period of several months. Wallace asked again for the “time series data (NOT MODELING) of ocean pH for 20th century.” Sabine responded by saying that it was inappropriate for Wallace to question their “motives or quality of our science,” adding that if he continued in this manner, “you will not last long in your career.” He then included a few links to websites that Wallace, after spending hours reviewing them, called “blind alleys.”  Sabine concludes the email with: “I hope you will refrain from contacting me again.” But communications did continue for several more exchanges.
In an effort to obtain access to the records Feely/Sabine didn’t want to provide, Wallace filed a Freedom of Information Act (FOIA) request.
In a May 25, 2013 email, Wallace offers some statements, which he asks Feely/Sabine to confirm:
“…it is possible that Dr. Sabine WAS partially responsive to my request. That could only be possible however, if only data from 1989 and later was used to develop the 20th century portion of the subject curve.
“…it’s possible that Dr. Feely also WAS partially responsive to my request. Yet again, this could not be possible unless the measurement data used to define 20th century ocean pH for their curve, came exclusively from 1989 and later (thereby omitting 80 previous years of ocean pH 20th century measurement data, which is the very data I’m hoping to find).
Sabine writes: “Your statements in italics are essentially correct.” He adds: “The rest of the curve you are trying to reproduce is from a modeling study that Dr. Feely has already provided and referenced in the publication.”
In his last email exchange, Wallace offers to close out the FOIA because the email string “clarified that your subject paper (and especially the ‘History’ segment of the associated time series pH curve) did not rely upon either data or other contemporary representations for global ocean pH over the period of time between the first decade of 1900 (when the pH metric was first devised, and ocean pH values likely were first instrumentally measured and recorded) through and up to just before 1988.” Wallace received no reply, but the FOIA was closed in July 2013 with a “no document found” response.
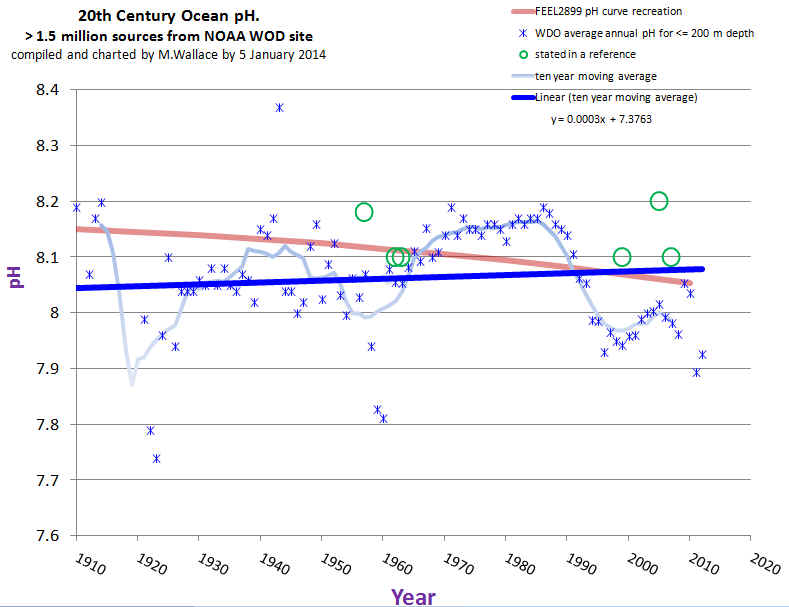
Interestingly, in this same general timeframe, NOAA reissued its World Ocean Database. Wallace was then able to extract the instrumental records he sought and turned the GEPH data into a meaningful time series chart, which reveals that the oceans are not acidifying. (For another day, Wallace found that the levels coincide with the Pacific Decadal Oscillation.) As Wallace emphasized: “there is no global acidification trend.”
MWAcompilationOfGlobalOcean_pHJan82014
Regarding the chart in question, Wallace concludes: “Ocean acidification may seem like a minor issue to some, but besides being wrong, it is a crucial leg to the entire narrative of ‘human-influenced climate change.’ By urging our leaders in science and policy to finally disclose and correct these omissions, you will be helping to bring honesty, transparency, and accountability back where it is most sorely needed.”
“In whose professional world,” Wallace asks, “is it acceptable to omit the majority of the data and also to not disclose the omission to any other soul or Congressional body?”

Thursday, December 18, 2014

San Francisco Chronicle: "Global-warming true believers are in denial"

Global-warming true believers are in denial

By Debra J. SaundersSan Francisco Chronicle columnist
December 18, 2014 9:08am 

I have a theory as to why Americans don’t worry all that much about global warming: High-profile purveyors of climate change don’t push for reductions in greenhouse gases so much as focus on berating people who do not agree with their opinions. They call themselves champions of “the science” — yet focus on ideology more than tangible results.
Their language is downright evangelical. Recently, science guy Bill Nye joined other experts who objected to the media’s use of the term “climate skeptic.” They released a statement that concluded, “Please stop using the word 'skeptic’ to describe deniers.” Deniers? Like Judas?
Why, they even hear voices from science. “Science has spoken,” U.N. Secretary-General Ban Ki-moon recently proclaimed. Some men think God talks to them; others hear Science.
Back to my original point: San Francisco liberal plutocrat Tom Steyer has called climate change “the defining issue of our generation.” He told the Hill, “Really, what we’re trying to do is to make a point that people who make good decisions on this should be rewarded, and people should be aware that if they do the wrong thing, the American voters are watching and they will be punished.”
You would assume from the above statement that Steyer wants to punish businesses or people who emit a super-size share of greenhouse gases. But no, Steyer’s big push for 2014 was to spend some $73 million to defeat Republicans who support the Keystone XL pipeline. But stopping Keystone won’t reduce America’s dependence on fossil fuels by one drop. It simply will make it harder to tap into Canadian tar-sands oil.
On Monday, state Senate President Pro Tem Kevin de León said he plans on introducing a measure to require that the California Public Employees’ Retirement System sell off any coal-related investments. In recent years, demands for disinvestment have visited universities. In May, Stanford voted to forgo investments in coal mining. Student groups have been pushing for Harvard and the University of California to dump fossil-fuel assets as well. It’s a good sign that those efforts have not prevailed at either institution. It’s a bad sign that de León has found a new soft target — CalPERS.
The problem, Harvard Professor Robert N. Stavins wrote for the Wall Street Journal, is: “Symbolic actions often substitute for truly effective actions by allowing us to fool ourselves into thinking we are doing something meaningful about a problem when we are not.” Disinvestment also does nothing to reduce energy use.
Matt Dempsey of Oil Sands Fact Check sees disinvestment as the new environmental talking point for 2016 races. It requires no visible personal sacrifice — while feeding activists’ sense of self-righteousness. Its emptiness is part of the allure. De León even told reporters that he’d write a bill that in no way “hurts investment strategies.”
Then there are the conferences — Kyoto, Copenhagen, Rio de Janeiro. The venues for Earth summits would make for a great episode of “Where in the World Is Carmen Sandiego?” The scions of science ought to get acquainted with Skype. If the future of the planet is at stake, shouldn’t the champions of science at least look as if they’re trying to curb their emissions?
Debra J. Saunders is a San Francisco Chronicle columnist.

Thursday, December 11, 2014

Maxwell's Demon proves why cold gases cannot make hot bodies hotter

James Clerk Maxwell is arguably the greatest physicist of all time on the topics of heat and radiation, and also perhaps the first to state in 1872 that Earth's temperature gradients and greenhouse effect are due to mass/gravity/pressure, rather than an effect of radiation from any infrared-active gases. 

Maxwell devised a simple and well-known thought experiment now called Maxwell's Demon, to prove why cold gases (such as the atmosphere at -18C on average), cannot make warmer gases or bodies (such as the Earth surface at +15C average) any warmer in violation of the second law of thermodynamics. 


The 2nd law of thermodynamics states disorder (called entropy) of any system (such as Earth's atmosphere) must always increase, and for any heat transfer to occcur from cold gases or bodies to warmer gases or bodies would result in an impossible decrease of entropy forbidden by the 2nd law of thermodynamics.


So, the next time someone claims a cold gas/body can make a warm body warmer, ask them for their solution to Maxwell's demon first:


Schematic of Maxwell's demon
Note: Maxwell along with his contemporaries and famous physicists including Clausius and Carnot (formally an engineer) all three agreed with each other in their writings that what is called today the 'greenhouse effect' was due only to the mass/gravity/pressure of the atmosphere, not radiation from gases. 

From Wikipedia entry on Maxwell's demon:


In the philosophy of thermal and statistical physicsMaxwell's demon is a thought experiment created by the physicist James Clerk Maxwell to "show that the Second Law of Thermodynamics has only a statistical certainty".[1] It demonstrates Maxwell's point by hypothetically describing how to violate the Second Law: a container of gas molecules at equilibrium is divided into two parts by an insulated wall, with a door that can be opened and closed by what came to be called "Maxwell's demon". The demon opens the door to allow only the faster than average molecules to flow through to a favored side of the chamber, and only the slower than average molecules to the other side, causing the favored side to gradually heat up while the other side cools down, thus decreasing entropy.


The second law of thermodynamics ensures (through statistical probability) that two bodies of different temperature, when brought into contact with each other and isolated from the rest of the Universe, will evolve to a thermodynamic equilibrium in which both bodies have approximately the same temperature.[6] The second law is also expressed as the assertion that in an isolated systementropy never decreases.[6]
Maxwell conceived a thought experiment as a way of furthering the understanding of the second law. His description of the experiment is as follows:[6][7]
... if we conceive of a being whose faculties are so sharpened that he can follow every molecule in its course, such a being, whose attributes are as essentially finite as our own, would be able to do what is impossible to us. For we have seen that molecules in a vessel full of air at uniform temperature are moving with velocities by no means uniform, though the mean velocity of any great number of them, arbitrarily selected, is almost exactly uniform. Now let us suppose that such a vessel is divided into two portions, A and B, by a division in which there is a small hole, and that a being, who can see the individual molecules, opens and closes this hole, so as to allow only the swifter molecules to pass from A to B, and only the slower molecules to pass from B to A. He will thus, without expenditure of work, raise the temperature of B and lower that of A, in contradiction to the second law of thermodynamics.


Schematic figure of Maxwell's demon
In other words, Maxwell imagines one container divided into two parts, A andB.[8][6] Both parts are filled with the same gas at equal temperatures and placed next to each other. Observing the molecules on both sides, an imaginary demonguards a trapdoor between the two parts. When a faster-than-average molecule from A flies towards the trapdoor, the demon opens it, and the molecule will fly from A to B. Likewise, when a slower-than-average molecule from B flies towards the trapdoor, the demon will let it pass from B to A

The average speed of the molecules in B will have increased while in A they will have slowed down on average. Since average molecular speed corresponds to temperature, the temperature decreases in Aand increases in B, contrary to the second law of thermodynamics. A heat engine operating between the thermal reservoirs A andB could extract useful work from this temperature difference.


The demon must allow molecules to pass in both directions in order to produce only a temperature difference; one-way passage only of faster-than-average molecules from A to B will cause higher temperature and pressure to develop on the B side.

Note cooling is not the new warming, and slowing of cooling is still cooling, not warming. 

Why Man-Made Global Warming Theory Confuses the Cause With the Effect

This next post in a series demonstrating physical & mathematical proofs why Maxwell's atmospheric mass/gravity/pressure (33C) greenhouse effect is the only correct explanation of the greenhouse effect will now show why the entire physical basis of the competing anthropogenic global warming theory (now out of necessity called "man-made climate change" since it hasn't warmed for 18-26 years), somehow conveniently ignored the well-established basic and atmospheric physics, physical chemistry, and barometric relations that had been well-established for more than the past two centuries, and effectively hide this in their overheated & untouchable black-box computer models. 

The models then serve the purpose of providing a veritable & impenetrable safety deposit box of ancient Fortran computer code, completely secured from inspection by anyone who doesn't have the key, or understand poorly-documented Fortran.  

The CAGW computer modelers also completely ignored the hundreds of physicists, atmospheric and rocket scientists, physical chemists, and other scientists who just a decade earlier (during the 1970's ice age scare) provided the immense, overwhelming physical, chemical, and observational proof of the gold standard 1976 US Standard Atmosphere calculations and the first computer model of the atmosphere (and the only model which has been verified with (millions) of observations), offering overwhelming evidence that greenhouse gases have no significant "radiative forcing" or "radiative imbalance" effects upon the Earth's atmosphere whatsoever, from the surface to edge of space. 

The Standard Atmosphere model does no radiative calculations from greenhouse gases or other gases, since these hundreds of scientists had previously established any such effects to be negligible. The calculations and std. atmosphere model do not ever utilize the absolutely essential Stefan-Boltzmann equation, nor any absorption/emission spectra from any IR-active gases at all to determine temperatures from "radiative imbalance," or "heat trapping," or "radiative forcing from greenhouse gases."

Bad things can happen when climate modelers conveniently ignore over 200 years of well-established physics, including confusing a cause with an effect, but that is unfortunately what has happened. We will now show additional reasons why man-made or natural CO2 cannot be the Earth's climate control knob, demonstrating how the IR emission spectra from greenhouse gases are simply an effect of and not the cause of the mass densities/gravity/pressure/viscosities of all gases present in each layer of the atmosphere all the way from the surface to the edge of space, which in-turn are entirely responsible for the resulting temperatures (via the Ideal Gas Law and other physical laws) at every altitude, not IR backradiation from passive IR absorbers/emitting gases (so-called "greenhouse gases" for the first time a decade later). 

The cause must always precede the effect, and the cause never follows the effect. As the greatest physicist in history on the topics of radiation and heat, J Clerk Maxwell, wrote in 1872, the atmospheric temperatures and gradients are a function of and caused by atmospheric pressure/density/specific heat capacity of the particular gases in the atmosphere, not the other way around as falsely assumed by CAGW proponents and the falsified & overheated climate models. 

Atmospheric pressure/density/specific heat capacity of the particular gases in the atmosphere produce temperature gradients without violating the 1st and 2nd laws of thermodynamics, increasing the surface temperature by ~33C above the equilibrium temperature with the Sun, and decreasing the top of the troposphere by even more 35C below of the equilibrium temperature with the Sun (an anti-greenhouse effect). By way of illustration (ignoring that temperature cannot be properly "averaged"):


Temperature at top of the troposphere at ~11,000 meters average ~220K (35C colder than the equilibrium temperature with the Sun of 255K

Temperature at the surface average ~288K (33C warmer than the equilibrium temperature with the Sun of 255K

(220 + 288)/2 = 254K ~ 255K

Thus energy is conserved as required by the 1st law of thermodynamics: 

dU = Q + W = 0 change in internal energy

where

dU = change in internal energy which must be zero or infinitesimally small in order to conserve energy
Q = any heating source of the system (i.e. the Sun only)
W = work done 

Thus

Q = -W (note the minus sign in front of the Work done, which must be exactly equal and opposite)

which in the case of the atmosphere, the Q is radiative forcing from the Sun, and Work done is the adiabatic compression and expansion of gases in the troposphere, which must be equal and opposite for energy to be conserved:


The climate modelers claim, however, that passive IR absorbers/radiators greenhouse gases somehow add 33C of heat energy to the planet to the 255K already provided by the Sun, causing the 255+33K = 288K surface temperature. However, they never mention (for very good reasons) that the US Standard Atmosphere above and observations show the troposphere also has an even greater 35C negative greenhouse effect from 255K falling to 220K at the top of the troposphere. 

How can any greenhouse gas allegedly "know" that it is supposed to heat only the troposphere by 33C below ~5100 meters altitude while simultaneously cooling the remainder of the troposphere by 35C from ~5100 - 11,000 meters altitude? They cannot, nor can computer models, without violating the 1st and 2nd laws of thermodynamics, and common sense. 

According to the radiative greenhouse proponents, the emission/absorption spectra shown below somehow prove greenhouse gases are the cause of and not the effect of the tropospheric lapse rate temperature gradient


But the annotations below show that the big notch in the emission spectra due to H2O and CO2 is simply the exact same temperatures all along the linear adiabatic lapse rate corresponding Planck blackbody curves. As we have shown many times, the lapse rate is controlled only by gravity and atmospheric heat capacity and not affected in the least by greenhouse gas concentrations. This proves that the greenhouse gases in the atmosphere are simply radiating at the temperatures set by the lapse rate equation, as expected:

dT/dh = -g/Cp

thus the temperature is a function of and an effect of gravity/molecular mass, not the other way around from greenhouse gas "radiative forcing" or "backradiation." Irradiance or "backradiation" from greenhouse gases is in turn a function of the 4th power of temperature (by the Stefan Boltzmann equation), not the cause of the temperatures to begin with.


The cause absolutely cannot follow the effect. Mass/gravity/pressure cause the Maxwell greenhouse effect and lapse rates, which causes the resulting temperature, which in-turn causes the greenhouse gases at each atmospheric temperature thus established to passively radiate IR at the above blackbody curves and absorption/emission spectra, not the other way around. You cannot have it both ways. One and only one 33C greenhouse effect theory can be correct, not both since otherwise the surface would be at least 33C warmer. 

In the next post of this series we will introduce newly improved and greatly simplified versions of the greenhouse equation proving all atmospheric temperatures can be derived without any knowledge of the surface temperature in advance, only the equilibrium temperature of Earth and the Sun plus the barometric formulae:


Why Atmospheric Temperature is a Linear Function of Mass & Gravity, and Not Influenced by Greenhouse Gas Concentrations

In the previous post of this series, we demonstrated why the US Standard Atmosphere Model & Observations Prove Maxwell's Mass/Gravity/Pressure Theory of the 'Greenhouse Effect' is Correct & Falsifies Anthropogenic Global Warming (CAGW).

We now show why the hundreds of rocket and atmospheric scientists, physicists, and aeronautical engineers who created the gold standard and final 1976 version of the US Standard Atmosphere Database (created during the ice age scare of the 1970's and just one decade prior to the global warming scare of the 1980's) in effect were "deniers" of any significant "radiative forcing," "heat trapping," or "radiative imbalance" from any greenhouse gases in their physical chemical calculations of the temperature profile of Earth's entire atmosphere from the surface all the way to the edge of space at ~100 kilometers altitude. 

In fact, the 241 page document provides overwhelming physical proof from physical chemistry and physics that the average annual temperatures at any altitude are controlled solely by molecular density, molecular weights, gravity, mass, pressure, etc. without any consideration of alleged "radiative forcing" or "heat trapping" from either natural or man-made CO2, nor any "radiative forcing" nor radiative considerations from any other gases including water vapor (now alleged to be the so-called 'primary greenhouse gas') whatsoever. The essential-to-CAGW claims of "radiative forcing," "heat trapping greenhouse gases," and "radiative imbalance from greenhouse gases" did not exist in 1976, and first appeared on the scene more than a decade later with James Hansen and the first IPCC 1990 report.

These pioneering atmospheric scientists calculated the effects of CO2 on the basis of the tiny 0.03-0.04% in the atmosphere (and thus contribution to molecular mass of the total atmosphere only ~0.03-0.04%) and found it to be so tiny and insignificant, that they removed CO2 from their 1-D model of the atmosphere completely. Their model was then used to calculate the US Standard Atmosphere database at every altitude from the surface to 100 km, and then overwhelmingly verified with millions of observations from weather balloons, research flights, rocket launches, etc. and found to accurately reproduce the temperatures on an annual basis at every altitude 0-120km within Earth's atmosphere, while completely omitting any mass, radiative, or any other effects from CO2 whatsoever.

In physics, the Stefan-Boltzmann equation is essential to calculate radiative emissions as a function of temperature (to the fourth power), but does not appear even one single time in any of the calculations in the 241 page US Standard Atmosphere description document or in their atmospheric model calculations. The Stefan-Boltzmann constant, which is absolutely essential to any radiative calculations from greenhouse gases or any gases or solid bodies also does not even appear once in the extensive tables of constants and definitions used in all of the calculations of the standard atmosphere, proving radiative considerations from any greenhouse gases are completely unnecessary to determine the average temperatures anywhere from the surface to the edge of space, and also that greenhouse gases have no radiative influence whatsoever upon the ~7 different lapse rates that occur in each of the ~7 different levels of the atmosphere from the surface to space. 

The Standard Atmosphere document indicates the only effect of water vapor upon the troposphere lapse rate is to reduce it from 9.8C/km to 6.5C/km on average, solely due to the high heat capacity Cp (1.865 Joules per gram per degree Kelvin) of water vapor compared to all of the other atmospheric gases. Per the lapse rate equation 

dT/dh = -g/Cp

where

dT = change in temperature with height
dh = change in height/geopotential altitude
g = gravitational acceleration constant = 9.8 meters/sec/sec
Cp = heat capacity at constant pressure (1 atmosphere constant pressure at the surface)

the temperature at any height or geopotential altitude is a function of and inversely related to heat capacity Cp. Thus any increase of Cp from water vapor will decrease the lapse rate and thus temperature at any height including at the surface (up to 25.5C as we previously calculated). This has absolutely nothing to do with "radiative forcing" from any greenhouse gases including water vapor itself. 

The first 6 of these linear lapse rates are shown in figure 3 below, and calculated entirely on the basis of geopotential altitude (a measure of gravitational potential energy PE) vs. molecular-scale temperature [defined in the scan below of page 9 as the mean molecular weight at that geopotential altitude], which has absolutely nothing to do with any alleged "heat trapping" or "radiative forcing" from any greenhouse gases:


Fig. 3 from the 1976 US Standard Atmosphere document below. Note the "Molecular-scale temperature is a function of the geopotential altitude." Thus, the kinetic temperature of the particular molecular masses and compositions of the atmosphere is a function of the geopotential height (which is the gravitational potential energy (PE) accumulated at that height) which adiabatically sets the pressure at that geopotential height. This is another way of saying temperature is a function of atmospheric mass/gravity/pressure, which is exactly what the Maxwell atmospheric mass/gravity/pressure 33C greenhouse effect claims, not "radiative forcing" from greenhouse gases. 

And we previous demonstrated with the greenhouse equation that we can exactly duplicate the 1976 US Standard Temperature database and model without even knowing anything about the surface temperature or greenhouse gases in advance, entirely based upon solar radiation at the Earth's surface, gravity, mass, and pressure of the atmosphere, proving no measurable effect from CO2. 
The "Greenhouse Equation" calculates temperature (T) at any location from the surface to the top of the troposphere as a function of atmospheric mass/gravity/pressure and radiative forcing from the Sun only, and without any radiative forcing from greenhouse gases. Note the pressure (P) divided by 2 in the greenhouse equation is the pressure at the center of mass of the atmosphere, where the temperature and height are equal to the equilibrium temperature with the Sun and average "Effective Radiating Level" or ERL, respectively. 
Fig 3 from the 1976 US Standard Atmosphere description document below, with added annotations showing how the center of the tropospheric lapse rate is "triangulated" by the known constants of mass and the center of mass, the height where the center of mass can be calculated which is where the mass above is 1/2 of the total mass and the Pressure (1/2 atm) is 1/2 of the surface pressure (1 atm), and the known constant of equilibrium temperature Te between the Earth and Sun. This is the exact location of the ERL, where the temperature must equal the equilibrium temperature with the Sun. By determining the height of the ERL, the greenhouse equation then extends the linear adiabatic lapse rate up to the top of the troposphere at ~12,000 meters and down to the surface at 0 meters, from which the entire tropospheric temperature profile from the top of the troposphere to the ERL to the surface temperature can be determined by only knowing the constant equilibrium temperature with the Sun = Te = 255K. 

Some commenters still doubt this is possible and conveniently claim [without any mathematical or observational proof whatsoever] as a last resort that greenhouse gases somehow control the lapse rates in each atmospheric layer. The US Standard Atmosphere and millions of confirming observations prove this is false, demonstrated by the linear kinematic velocity graph shown from the US Standard Atmosphere report below (from page 19 also scanned further below), which shows an almost perfect linear relationship between geopotential altitude and kinematic velocity from the surface to space, calculated entirely without any radiative forcing whatsoever and confirmed by observations. 

Greenhouse gas concentrations of the primary greenhouse gas water vapor and other greenhouse gases including methane, ozone, (and even CO2 to some extent) vary tremendously from the surface to the ~100 km edge of space, thus if "radiative forcing" from water vapor or any other greenhouse gases had anything to do with the cause of temperatures at any altitude, the kinematic viscosity would be nonlinear instead of linear, and the dynamic viscosity profile would not match the temperature profile (but the standard atmosphere shows it does). 


And the physical definitions and units below show radiance has nothing to do with any of these physical calculations nor interrelationships:

Physical definitions and units of kinematic viscosity, dynamic viscosity, mass density, weight and how they are related. None are defined on the basis of radiance or "radiative forcing"

This proves that only kinematic viscosity effects, not radiative effects, of any gases including greenhouse gases, are what determine the kinematic temperatures at all locations, not "greenhouse gas radiative forcing."  The only true source of radiative forcing is the Sun, not greenhouse gases which are mere passive IR-radiators & heat sinks, which help to cool the atmosphere by radiative loss to space, just like a bigger heat sink on your microprocessor does. 

After all of the above calculations were made by the US Std Atm scientists, the final calculation of the coefficient of thermal conductivity in W/(mK) was as their final step and determined solely as a function of geometric altitude/mass/density/viscosity. The document specifies below (page 20) that their ultimate calculation of the coefficient of thermal conductivity was the effect and not the cause of geometric altitude/mass/density/viscosity exclusively, and thus not "radiation trapping" nor any radiative calculations from any greenhouse gases whatsoever. The profile of these curves also nearly match the US Std Atmosphere temperature and dynamic viscosity graphs above indicating their direct relationship as gravity/mass the cause of and not the effect of any radiative forcing whatsoever.
Therefore, this provides the ultimate physical and observational proof that Maxwell's (33C) mass/pressure/gravity "greenhouse theory" of the (7) atmospheric temperature gradients is absolutely correct, thus falsifying the radiative greenhouse theory that is essential to the CAGW hypothesis. 


It is now absolutely clear that the greenhouse-gas radiative "greenhouse" theory has simply confused cause with effect. The Maxwell mass/gravity/pressure 33C "greenhouse theory" was proved physically and verified with the millions of observations of the 1976 US Standard atmosphere physical and modelled derivation and confirming observations, proving that temperatures everywhere from the surface to space are due to solar radiation plus the effect of atmospheric mass/gravity, thereby excluding any significant radiative effects from greenhouse gases (other than radiative cooling effects essential for the atmosphere to lose heat to space, i.e. the opposite of "trapping heat"). Only one of these two competing 33C "greenhouse effect" theories can be true, you simply cannot have it both ways, because if you did, the Earth would be 33C warmer at the surface than the present (in addition to multiple violations of physical laws). 

In our next post we will show why the radiation spectra of Earth seen from the ground and space are the effect of and not the cause of the entire atmospheric and surface profiles. 


CO2 and water vapor concentrations to number/mass density of the atmosphere are both so small they were calculated and then removed from consideration in the 1-D model of the atmosphere that perfectly reproduces the observations all the way to space.

1976 version of the US Standard Atmosphere

This is the most recent version and differs from previous versions only above 32 km:
Subscript bGeopotential
altitude above MSL[3]
Static pressureStandard temperature
(K)
Temperature Lapse Rate
(m)(ft)(pascals)(inHg)(K/m)(K/ft)
00010132529.92126288.15-0.0065-0.0019812
111,00036,08922632.16.683245216.650.00.0
220,00065,6175474.891.616734216.650.0010.0003048
332,000104,987868.0190.2563258228.650.00280.00085344
447,000154,199110.9060.0327506270.650.00.0
551,000167,32366.93890.01976704270.65-0.0028-0.00085344
671,000232,9403.956420.00116833214.65-0.002-0.0006096
Us standard atmosphere model.png
The conventional radiative theory cannot explain why the linear lapse rates in each of the ~7 atmospheric layers defined in the US Std Atmosphere table above vary from positive to zero to negative on the basis of greenhouse gas radiative forcing, since the concentrations of the various greenhouse gases at each of these 7 levels varies tremendously in each level, often in the opposite direction to the concentrations of the composition and amounts of greenhouse gases in each level. It is frankly impossible for each greenhouse gas to magically have the opposite warming and cooling (or no) effects simply dependent upon the altitudes of the 7 different layers. In addition, the only greenhouse gases above level 4 above are CO2 and O3, which somehow are claimed by radiative proponents to magically warm the stratosphere and thermosphere, but cool the mesosphere. How can CO2 magically change it's radiative effects between layers of allegedly cooling 3 layers, having no effect on 3 layers, and the opposite warming effect on other layers? It cannot. CO2 and other greenhouse gases can only have the same passive IR absorbers/emitters in all 7 layers, increasing radiative surface area and thus cooling of the entire atmosphere to space.
Additional scans from the US Std Atmosphere proving all of the points above: