Papers reported in 2015
Solar Irradiance Variability and Climate
Solanki et al. 2013 Annu. Rev. Astron. Astrophys. 51, 311-351
The brightness of the Sun varies on all time scales on which it has been observed, and there is increasing evidence that it has an influence on climate. The amplitudes of such variations depend on the wavelength and possibly on the time scale. Although many aspects of this variability are well established, the exact magnitude of secular variations (going beyond a solar cycle) and the spectral dependence of variations are under discussion. The main drivers of solar variability are thought to be magnetic features at the solar surface. The climate reponse can be, on a global scale, largely accounted for by simple energetic considerations, but understanding the regional climate effects is more difficult. Promising mechanisms for such a driving have been identified, including through the influence of UV irradiance on the stratosphere and dynamical coupling to the surface. Here we provide an overview of the current state of our knowledge, as well as of the main open questions.
Robust Response of the East Asian Monsoon Rainband to Solar Variability
Zhao and Wang 2014 Journal of Climaten 27, 3043-3051
This study provides evidence of the robust response of the East Asian monsoon rainband to the 11-yr solar cycle and first identify the exact time period within the summer half-year (1958-2012) with the strongest correlation between the mean latitude of the rainband (MLRB) over China and the sunspot number (SSN). This period just corresponds to the climatological-mean East Asian mei-yu season, characterized by a large-scale quasi-zonal monsoon rainband (i.e., 22 May-13 July). Both the statistically significant correlation and the temporal coincidence indicate a robust response of the mei-yu rainband to solar variability during the last five solar cycles. During the high SSN years, the mei-yu MLRB lies 1.2 ° farther north, and the amplitude of its interannual variations increases when compared with low SSN years. The robust response of monsoon rainband to solar forcing is related to an anomalous general atmospheric pattern with an up-down seesaw and a north-south seesaw over East Asia.
Cosmic ray event of A.D. 774-775 shown in quasi-annual 10Be data from the Antarctic Dome Fuji ice core
Miyake et al. 2015 Geophysical Research Letters
14C content in tree rings and 10Be concentration records in polar ice core provide information about past cosmic ray intensities. The A.D. 774-775 cosmic ray event has been identified by 14C measurement in several tree rings from all over the world. Although the quasi-decadal 10Be Dome Fuji data in the Antarctic ice core also shows a sharp peak around A.D. 775, annual 10Be variations in the Dome Fuji core or in other cores have not been revealed. We have measured quasi-annual 10Be concentrations from approximately A.D. 763-794 in the Dome Fuji ice core, and detected a clear increase (c. 80% above the baseline) in 10Be concentration around A.D. 775. However, an accurate height of this increase is not straightforwardly estimated due to the background variation in 10Be concentration. The 10Be increase can be due to the same cosmic ray event as shown in the 14C content in A.D. 774-775.
Abrupt Holocene Indian Summer Monsoon failures: A primary response to solar activity?
Xu et al. 2015 The Holocene
Knowledge of the millennial abrupt monsoon failures is critical to understanding the related causes. Here, we extracted proxy indices of Indian Summer Monsoon (ISM) intensity during the early to mid-Holocene, from peat deposits at Lake Xihu, in southwestern China. There are a series of abrupt, millennial-scale episodes of ISM weakening inferred from the Lake Xihu records, which are generally synchronous with those inferred from other archives over ISM areas. An important feature is that the ISM failures inferred from the Lake Xihu proxy indices synchronize well with abrupt changes in solar activity. We argue that changes in solar activity play a primary role in producing most of these millennial ISM failures, while some other causes, including freshwater outbursts into the North Atlantic Ocean and changes in sea surface temperatures of the eastern tropical Pacific Ocean, may have also exerted influences on parts of the millennial ISM failures.
Solar forcing of Earth's surface temperature in PMIP3 simulations of the last millennium
Le 2014 Atmospheric Science Letters
This study quantitatively diagnose the linkage between Total Solar Irradiance (TSI) and Earth's near-surface air temperature (TAS) of past 1000-year as simulated by Paleoclimate Modeling Intercomparison Project 3 (PMIP3) models. The results demonstrate that there is causal feedback of TAS from TSI variations, especially in the tropical and subtropical regions. The consistency between models in simulating solar signal in TAS responses is significant in these regions with more than 70% selected models showing agreement. There is no agreement between models in simulating TSI-TAS relationship in mid and high latitude regions.
papers reported in 2014
Evidence for the Gleissberg solar cycle at the high-latitudes of the Northern Hemisphere
Ogurtsov et al. 2014 Advances in Space Research
Time evolution of growing season temperatures in the Northern Hemisphere was analysed using both wavelet and Fourier approaches. A century-scale (60-140 year) cyclicity was found in the summer temperature reconstruction from the Taymir peninsula (72 N, 105 E) and other high-latitude (60-70 N) regions during the time interval AD 1576-1970. This periodicity is significant and consists of two oscillation modes, 60-70 year and 120-140 year variations. In the summer temperatures from the Yamal peninsula (70 N, 67 E) only a shorter-term (60-70 year) variation is present. A comparison of the secular variation in the Northern Hemisphere temperature proxies with the corresponding variations in sunspot numbers and the fluxes of cosmogenic 10Be in Greenland ice shows that a probable cause of this variability is the modulation of temperature by the century-scale solar cycle of Gleissberg. This is consistent with the results obtained previously for Northern Fennoscandia (67-70 N, 19-33 E). Thus, evidence for a connection between century-long variations in solar activity and climate was obtained for the entire boreal zone of the Northern Hemisphere.
Ultraviolet radiation exposure of a high arctic lake in Svalbard during the Holocene
Nevalainen et al. 2014 Boreas
Long-term fluctuations in lake-water optical properties were examined using a Holocene sediment sequence and multi-proxy palaeolimnological approach in Lake Einstaken, Nordaustlandet, Svalbard. UV-absorbance of sedimentary cladoceran remains provided information on underwater UV exposure and changes in lake-catchment coupling processes were inferred from sediment geochemistry. In addition, aquatic community succession was used as an indicator for lake-water bio-optical properties and a Holocene record of sun activity (sunspots) was utilized to evaluate long-term solar forcing. The results indicated that the UV-absorbance of cladoceran remains was highest (i.e. maximum UV-induced pigmentation) for a short period during the early Holocene and for several millennia during the mid-Holocene. Sun activity was high during these time intervals, probably impacting the UV intensities, but it is probable that the amount of UV-attenuating compounds (e.g. dissolved organic carbon (DOC)) also significantly affected the underwater UV environment and were low during high UV exposure. Benthic autotrophic communities also responded to the millennial changes in lake-water optical properties. UV-resistant Nostoc cyanobacterial colonies were established during the mid-Holocene, indicative of high underwater UV intensities, and Fontinalis mosses thrived during the early Holocene, indicating a highly transparent water column. The results further suggested that underwater UV exposure decreased during the late Holocene, which is probably attributable to increased DOC and decreased solar forcing. Owing to the location of Lake Einstaken and its catchment in the periglacial barren landscape of the polar desert, the fluctuations of bio-optical lake-water properties were apparently forced by postglacial environmental processes and Holocene climate development. These factors controlled sea shoreline proximity, water discharge, ice-cover duration and littoral-benthic primary production and further affected the underwater UV environment. Although the role of solar forcing cannot be underestimated, the current record emphasizes the role of climate-mediated lake-catchment interactions in impacting bio-optical properties and UV exposure of high arctic aquatic systems.
Origin and palaeoenvironmental significance of C25 and C27n-alk-1-enes in a 25,000-year lake-sedimentary record from equatorial East Africa
van Bree et al. 2014 Geochimica et Cosmochimica Acta
We studied the distribution of long-chain alkenes (n-C23 to n-C31) in well-dated sediments from Lake Challa, a deep crater lake near Mt. Kilimanjaro in equatorial East Africa, to reveal signatures of palaeo-environmental and palaeo-climatic changes affecting the production of these compounds during the last 25 kyr. The apolar fractions of organic sediment extracts dated to the last 16 kyr showed an unusual dominance of d13C-depleted n-C25:1 and n-C27:1 alk-1-enes. These alkenes were not detected in soil and litter from near the shoreline and from the inner rim of the crater, pointing to an autochthonous, aquatic source. Analysis of suspended particulate matter indicated that the n-alk-1-enes are produced in the well-oxygenated upper 30 m of the water column, indicating a phytoplanktonic origin. Sedimenting particles collected monthly from December 2006 to November 2007 showed increased fluxes of n-alk-1-enes following the locally prominent short rain season in November-December. Green algae and/or cyanobacteria were identified as candidate sources of these alkenes. Production of the n-C25:1 and n-C27:1 alkenes in Lake Challa was much reduced during the Last Glacial Maximum and early late-glacial period, suggesting a temperature or CO2 effect on habitat suitability. We explored the potential of n-alk-1-ene accumulation rates, and of a derived Alkene Index [n-C27:1]/([n-C25:1] + [n-C27:1]), to record longer-term climatic changes. The Alkene Index record of Lake Challa over the past 25 kyr shows clear periodicity with a dominant frequency of c. 2.3 kyr, potentially indicative of monsoon variability directly or indirectly forced by variation in solar radiation.
Influence of Solar Activity on the Climate Change
Kovalenko and Zherebtsov 2014 Atmospheric and Oceanic Optics 27, 506-510
We discuss problems which are of main importance for understanding the nature of climate changes in the 20th century and basic physical processes responsible for these changes. A possible role of solar activity in the Earth's climate changes in the past and future is considered. As shown, physical mechanisms which can provide for the solar variability effect on the weather and climate are reduced to the control of the energy flux from the Earth to space. A special emphasis is given on the solar activity effect on climatic characteristics of the troposphere through the atmospheric electricity. We consider peculiarities of the response of thermal and dynamic regimes of the World Ocean and atmosphere to solar activity changes and processes in the atmosphere, ocean, and cryosphere. We also show and discuss results of the analysis of regularities and peculiarities of troposphere and the ocean surface temperature response to both isolated heliogeophysical disturbances and long term changes in solar and geomagnetic activity.
Modulation of UK lightning by heliospheric magnetic field polarity
Owens et al. 2014 Environmental Research Letters 9 115009
Observational studies have reported solar magnetic modulation of terrestrial lightning on a range of time scales, from days to decades. The proposed mechanism is two-step: lightning rates vary with galactic cosmic ray (GCR) flux incident on Earth, either via changes in atmospheric conductivity and/or direct triggering of lightning. GCR flux is, in turn, primarily controlled by the heliospheric magnetic field (HMF) intensity. Consequently, global changes in lightning rates are expected. This study instead considers HMF polarity, which doesn't greatly affect total GCR flux. Opposing HMF polarities are, however, associated with a 40-60% difference in observed UK lightning and thunder rates. As HMF polarity skews the terrestrial magnetosphere from its nominal position, this perturbs local ionospheric potential at high latitudes and local exposure to energetic charged particles from the magnetosphere. We speculate as to the mechanism(s) by which this may, in turn, redistribute the global location and/or intensity of thunderstorm activity.
Frequency Characteristic of Response of Surface Air Pressure to Changes in Flux of Cosmic Rays
Bogdanov 2014 Geomagnetism and Aeronomy 54, 813-818
We compare the series of daily-average values of the surface air pressure for De Bilt and Lugano meteorological stations with subtracted linear trends and seasonal harmonics, as well as the series of the flux of galactic cosmic rays (GCRs) at Jungfraujoch station with subtracted moving average over 200 days. Using the method of superposed epochs, we show that the Forbush decreases at both stations are accompanied by increased pressure. Spectral analysis allows us to conclude that the analyzed series are characterized by nonzero coherence in almost the entire frequency range: from 0.02 day-1 up to the Nyquist frequency of 0.5 day-1. Using changes in the GCR flux as a probing signal, we obtain amplitude-frequency characteristics of the pressure reaction. For both stations, these characteristics are in qualitative agreement with each other and indicate that the atmospheric response can be described by a second-order linear dynamic system that has wide resonance with a maximum at a frequency of 0.15 day-1.
Do sunspot numbers cause global temperatures? Evidence from a frequency domain causality test
Gupta et al. 2014 Applied Economics
This article applies the causality test in the frequency domain, developed by Breitung and Candelon (2006), to analyse whether sunspot numbers (used as a partial approximation to solar irradiance) cause global temperatures, using monthly data covering the time period 1880:1-2013:9. While standard time domain Granger causality test fails to reject the null hypothesis that sunspot numbers do not cause global temperatures for both full and sub-samples (identified based on tests of structural breaks), the frequency domain causality test detects predictability for both the full-sample and the last sub-sample at short (2-2.6 months) and long (10.3 months and above) cycle lengths, respectively. Our results highlight the importance of analysing causality using the frequency domain test, which, unlike the time domain Granger causality test, allows us to decompose causality by different time horizons, and hence, could detect predictability at certain cycle lengths even when the time domain causality test might fail to pick up any causality. Further, given the widespread discussion in the literature, those results for the full-sample causality, irrespective of whether it is in time or frequency domains, cannot be relied upon when there are structural breaks present, and one needs to draw inference regarding causality from the sub-samples, we can conclude that there has been an emergence of causality running from sunspot numbers to global temperatures only recently at cycle length of 10.3 months and above.
A 2700 cal yr BP extreme flood event revealed by sediment accumulation in Amazon floodplains
Moreira-Turcq et al. 2014 Palaeogeography, Palaeoclimatology, Palaeoecology 415, 175-182
Climatic conditions are one of the most important factors affecting hydrological processes in fluvial systems. Higher discharges are responsible for higher erosion, greater transport, and also higher deposition. Consequently, sediment accumulation in Amazonia floodplain river-connected lakes can be directly related to hydrological patterns of the Amazon River mainstream. In this context, we analyzed five sediment cores taken in two floodplain systems situated in the lower Amazon River, to investigate sediment accumulation patterns during the Holocene. Our records show abrupt fluctuations in sedimentation rates in lakes that can reach more than 2 cm/yr during some periods. We find that in all cores, sediment stratigraphy is characterized by packages of sediments of uniform age, which are typically 10-80 cm thick and present a variegated color. The 14C age of the upper package is about 2700 cal yr BP. During this abrupt event, sediment accumulation rates in floodplain lakes can be at least 200 times higher than those of "normal" periods. This sedimentation event is interpreted as being the consequence of one or several successive extreme floods. The 2700 cal yr BP event has been also observed in other sites in South America and other regions in the world, although different impacts can be observed in each system. This event probably corresponds to a conjunction of favorable conditions for extreme Amazon discharge associated with the Middle to Late Holocene increase of austral summer insolation and shifts of the Intertropical Convergence Zone (ITCZ) from northern to southern positions. In this context, a marked negative peak in solar irradiance at 2700 cal yrs BP seems to have provoked cooling on the continents and a southward shift of the ITCZ associated with a probable reduction in the Atlantic Meridian Overturning Circulation.
Ultra-high-resolution paleoenvironmental records via direct laser-based analysis of lipid biomarkers in sediment core samples
Wörmer et al. 2014 PNAS
Lipid biomarkers in geological samples are important informants regarding past environments and ecosystems. Conventional biomarker analysis is labor intensive and requires relatively large sediment or rock samples; temporal resolution is consequently low. Here, we present an approach that has the potential to revolutionize paleoenvironmental biomarker research; it avoids wet-chemical sample preparation and enables analysis of biomarkers directly on sediment cores at submillimeter spatial resolution. Our initial application to a sediment core deposited during the Holocene climate optimum in the Mediterranean Sea reveals a new view of how small-scale variations in lipid distribution are integrated into commonly reported signals obtained by conventional analysis and demonstrates a strong influence of the c.200-y de Vries solar cycle on sea-surface temperatures and planktonic archaeal ecology.
A 449 year warm season temperature reconstruction in the southeastern Tibetan Plateau and its relation to solar activity
Duan & Zhang 2014 Journal of Geophysical Research: Atmospheres
There is a close relationship between solar activity and the Earth's surface temperature, but this relationship has weakened with recent global warming. To better understand this puzzle, temperature records need to be extended, and the relationship between long-term variation in temperature and solar activity needs to be examined. In this study, we reconstruct April-September temperature variation back to 1563 using tree ring maximum late wood density (MXD) data from Balfour spruce in the southeastern Tibetan Plateau (TP). Spatial correlation analysis indicates that our reconstruction is representative of temperature variability over the large-scale TP. On the 22 year time scale, the reconstructed April-September temperature corresponds generally to solar activity over the past three centuries. Spectral analyses also indicate that the significant periodicities of c. 11 years, 54 years, and 204 years observed in the MXD chronology correspond to the Schwabe cycle, the fourth harmonic of the Suess cycle, and the Suess solar cycle, respectively. However, disparities between temperature change and solar activity are identified in two periods, the 1880s-1900s and the 1980s-present. These results suggest that solar forcing is the critical driver for long-term temperature variability in the TP, but other factors may uncouple surface temperature and solar activity in some periods. One possible cause of the weak effect of solar activity on temperature during the 1880s-1900s is internal climate variability, while human-activity-induced greenhouse gas emissions have likely superseded solar forcing as the major driver of the rapid warming observed since the 1980s.
Mount Logan ice core record of tropical and solar influences on Aleutian Low variability: 500-1998 A.D.
Osterberg et al. 2014 Journal of Geophysical Research: Atmospheres
Continuous, high-resolution paleoclimate records from the North Pacific region spanning the past 1500 years are rare; and the behavior of the Aleutian Low (ALow) pressure center, the dominant climatological feature in the Gulf of Alaska, remains poorly constrained. Here we present a continuous, 1500 year long, calibrated proxy record for the strength of the wintertime (December-March) ALow from the Mount Logan summit (PR Col; 5200 m asl) ice core soluble sodium time series. We show that ice core sodium concentrations are statistically correlated with North Pacific sea level pressure and zonal wind speed. Our ALow proxy record reveals a weak ALow from circa 900-1300 A.D. and 1575-1675 A.D., and a comparatively stronger ALow from circa 500-900 A.D., 1300-1575 A.D., and 1675 A.D. to present. The Mount Logan ALow proxy record shows strong similarities with tropical paleoclimate proxy records sensitive to the El Niño-Southern Oscillation and is consistent with the hypothesis that the Medieval Climate Anomaly was characterized by more persistent La Niña-like conditions while the Little Ice Age was characterized by at least two intervals of more persistent El Niño-like conditions. The Mount Logan ALow proxy record is significantly (p < 0.05) correlated and coherent with solar irradiance proxy records over various time scales, with stronger solar irradiance generally associated with a weaker ALow and La Niña-like tropical conditions. However, a step-like increase in ALow strength during the Dalton solar minimum circa 1820 is associated with enhanced Walker circulation. Furthermore, rising CO2 forcing or internal variability may be masking the twentieth century rise in solar irradiance.
The cause of solar dimming and brightening at the Earth's surface during the last half century: Evidence from measurements of sunshine duration
Stanhill et al. 2014 Journal of Geophysical Research: Atmospheres
Analysis of the Angstrom-Prescott relationship between normalized values of global radiation and sunshine duration measured during the last 50 years made at five sites with a wide range of climate and aerosol emissions showed few significant differences in atmospheric transmissivity under clear or cloud-covered skies between years when global dimming occurred and years when global brightening was measured, nor in most cases were there any significant changes in the parameters or in their relationships to annual rates of fossil fuel combustion in the surrounding 1° cells. It is concluded that at the sites studied changes in cloud cover rather than anthropogenic aerosols emissions played the major role in determining solar dimming and brightening during the last half century and that there are reasons to suppose that these findings may have wider relevance.
Holocene cyclic climatic variations and the role of the Pacific Ocean as recorded in varved sediments from northeastern China
Chu et al. 2014 Quaternary Science Reviews 102, 85-95
We present an n-alkane and compound-specific carbon isotope record of the past 9 ka from the annually laminated sedimentary sequence of Lake Xiaolongwan, northeastern China. The n-alkane distribution suggests that Lake Xiaolongwan has undergone a shift from an oligotrophic state with low algal production and little emergent/submerged macrophytes in the early Holocene, to a eutrophic state with high algal production and abundant emergent/submerged macrophytes since the middle Holocene. The pattern of variation observed in the biomarker proxies ACL (the n-alkane average chain length), Paq (aquatic macrophyte versus aquatic macrophyte and terrestrial plant ratio), and LPTP (lake productivity/terrigenous organic production) is throughout the record similar to that of the total organic carbon. The variation of compound-specific carbon isotopic values in the middle- and short-chain alkanes was mainly regulated by lake productivity and the accumulating organic pool through time. In this forested region, where the vegetation is dominated by C3 plants, the long-chain n-alkanes (C27-C31) are predominantly derived from leaf wax lipids. The compound-specific δ13C27-31 value is sensitive to effective precipitation, and therefore represents a useful indicator of regional monsoonal precipitation. Spectral analysis on the δ13C27-31 time series reveals significant periodicities of 87-89, 205-212, 1020-1050 and 1750-2041 years. On the centennial timescale, the quasi-periodicities around 88 and 210 years suggest a strong link between solar activity and monsoon rainfall. The millennial monsoon cycle in northeastern China is associated with sea surface temperature (SST) variations in two active centers of the summer monsoon, the western Pacific Subtropical High (WPSH) and the Okhotsk High. Increasing SST in the subtropical sea may cause a northwards shift of the WPSH, which extends the monsoon rain band (Meiyu) to northeastern China, and thus increasing rainfall in that region. Meanwhile, decreasing SST in the Okhotsk Sea may strengthen the Okhotsk high, bringing more moisture into northeastern China. We suggest that the Pacific Ocean is a main regulator for summer monsoon rainfall in northeastern China at present and at different time scales during the Holocene.
Quasi-biennial oscillation and solar cycle influences on winter Arctic total ozone
Li and Tung 2014 Journal of Geophysical Research: Atmospheres 119, 5823-5835
The total column ozone (TCO) observed from satellites and assimilated in the European Centre for Medium-Range Weather Forecasts since 1979 is used as an atmospheric tracer to study the modulations of the winter Arctic stratosphere by the quasi-biennial oscillation (QBO) and the solar cycle. It is found that both the QBO and solar forcings in low latitudes can perturb the late winter polar vortex, likely via planetary wave divergence, causing an early breakdown of the vortex in the form of sudden stratospheric warming. As a result, TCO within the vortex in late winter can increase by ˜60 Dobson unit during either a solar maximum or an easterly phase of the QBO, or both, relative to the least perturbed state when the solar cycle is minimum and the QBO is in the westerly phase. In addition, from the solar maximum to the solar minimum during the QBO easterly phase, the change in TCO is found to be statistically insignificant. Therefore, the "reversal" of the Holton-Tan effect, reported in some previous studies using lower stratospheric temperature, is not evident in the TCO behavior of both observation and assimilation.
Solar forcing of Nile discharge and sapropel S1 formation in the early to middle Holocene eastern Mediterranean
Hennekam et al. 2014 Paleoceanography 29, 343-356
We present high-resolution records for oxygen isotopes of the planktic foraminifer Globigerinoides ruber (d18Oruber) and bulk sediment inorganic geochemistry for Holocene-age sediments from the southeast Mediterranean. Our d18Oruber record appears to be dominated by Nile discharge rather than basin-scale salinity/temperature changes. Nile discharge was enhanced in the early to middle Holocene relative to today. The timing of the long-term maximum in Nile discharge during the early Holocene corresponds to the timing of maximum intensity of the Indian Ocean-influenced Southwest Indian summer monsoon (SIM). This coincidence suggests a major influence of an Indian Ocean moisture source on Nile discharge in the early to middle Holocene, while, presently, the Atlantic Ocean is the main moisture source. Nile discharge was highly variable on multicentennial time scale during the early to middle Holocene, being strongly influenced by variable solar activity. This solar-driven variability is also recorded in contemporaneous SIM records, however, not observed in an Atlantic Ocean-derived West African summer monsoon record from the Holocene. This supports the hypothesis that the Indian Ocean moisture source predominantly controlled Nile discharge at that time. Solar-driven variability in Nile discharge also influenced paleoenvironmental conditions in the eastern Mediterranean. Bulk sediment Ba/Al and V/Al, used as indicators for (export) productivity and redox conditions, respectively, varied both in response to solar forcing on multicentennial time scales. We suggest that changes in Nile discharge on these time scales have been concordant with nutrient inputs to, and shallow ventilation of, the eastern Mediterranean.
Solar-wind-driven geopotential height anomalies originate in the Antarctic lower troposphere
Lam et al. 2014 Geophysical Research Letters
We use NCEP/NCAR reanalysis data to estimate the altitude and timelag dependence of the correlation between the interplanetary magnetic field component, By, and the geopotential height anomaly above Antarctica. The correlation is most statistically significant within the troposphere. The peak in the correlation occurs at greater timelags at the tropopause (c. 6-8 days) and in the mid-troposphere (c. 4 days), than in the lower troposphere (c. 1 day). This supports a mechanism involving the action of the global atmospheric electric circuit, modified by variations in the solar wind, on lower tropospheric clouds. The increase in timelag with increasing altitude is consistent with the upward propagation by conventional atmospheric processes of the solar-wind-induced variability in the lower troposphere. This is in contrast to the downward propagation of atmospheric effects to the lower troposphere from the stratosphere due to solar-variability-driven mechanisms involving ultra-violet radiation or energetic particle precipitation.
Is a sudden increase of irregularity of sunspot numbers a precursor of a return to low solar activity?
Shapoval et al. 2014 Journal of Geophysical Research - Space Physics
We have recently introduced an irregularity index λ for daily sunspot numbers International Sunspot Number (ISSN), derived from the well-known Lyapunov exponent, that attempts to reflect irregularities in the chaotic process of solar activity. Like the Lyapunov exponent, the irregularity index is computed from the data for different embedding dimensions m (2-32). When m = 2, λ maxima match ISSN maxima of the Schwabe cycle, whereas when m = 3, λ maxima occur at ISSN minima. The patterns of λ as a function of time remain similar from m = 4 to 16: the dynamics of λ change between 1915 and 1935, separating two regimes, one from 1850 to 1915 and the other from 1935 to 2005, in which λ retains a similar structure. A sharp peak occurs at the time of the ISSN minimum between cycles 23 and 24, possibly a precursor of unusual cycle 24 and maybe a new regime change; λ is significantly smaller during the ascending and descending phases of solar cycles. Differences in values of the irregularity index observed for different cycles reflect differences in correlations in sunspot series at a scale much less than the 4 year sliding window used in computing them; the lifetime of sunspots provides a source of correlation at that time scale. The burst of short-term irregularity evidenced by the strong λ peak at the minimum of cycles 23 and 24 would reflect a decrease in correlation at the time scale of several days rather than a change in the shape of the cycle.
Natural variability, radiative forcing and climate response in the recent hiatus reconciled
Huber and Knutti 2014 Nature Geoscience 7, 651-656
Global mean surface warming over the past 15 years or so has been less than in earlier decades and than simulated by most climate models. Natural variability, a reduced radiative forcing, a smaller warming response to atmospheric carbon dioxide concentrations8, 9 and coverage bias in the observations10 have been identified as potential causes. However, the explanations of the so-called 'warming hiatus' remain fragmented and the implications for long-term temperature projections are unclear. Here we estimate the contribution of internal variability associated with the El Niño/Southern Oscillation (ENSO) using segments of unforced climate model control simulations that match the observed climate variability. We find that ENSO variability analogous to that between 1997 or 1998 and 2012 leads to a cooling trend of about -0.06 °C. In addition, updated solar and stratospheric aerosol forcings from observations explain a cooling trend of similar magnitude (-0.07 °C). Accounting for these adjusted trends we show that a climate model of reduced complexity with a transient climate response of about 1.8 °C is consistent with the temperature record of the past 15 years, as is the ensemble mean of the models in the Coupled Model Intercomparison Project Phase 5 (CMIP5). We conclude that there is little evidence for a systematic overestimation of the temperature response to increasing atmospheric CO2 concentrations in the CMIP5 ensemble.
Indian summer monsoon rainfall: Dancing with the tunes of the sun
Hiremath et al. 2014 New Astronomy
There is strong statistical evidence that solar activity influences the Indian summer monsoon rainfall. To search for a physical link between the two, we consider the coupled cloud hydrodynamic equations, and derive an equation for the rate of precipitation that is similar to the equation of a forced harmonic oscillator, with cloud and rain water mixing ratios as forcing variables. Those internal forcing variables are parameterized in terms of the combined effect of external forcing as measured by sunspot and coronal hole activities with several well known solar periods (9, 13 and 27 days; 1.3, 5, 11 and 22 years). The equation is then numerically solved and the results show that the variability of the simulated rate of precipitation captures very well the actual variability of the Indian monsoon rainfall, yielding vital clues for a physical understanding that has so far eluded analyses based on statistical correlations alone. We also solved the precipitation equation by allowing for the effects of long-term variation of aerosols. We tentatively conclude that the net effects of aerosols variation are small, when compared to the solar factors, in terms of explaining the observed rainfall variability covering the full Indian monsoonal geographical domains.
Persistent link between solar activity and Greenland climate during the Last Glacial Maximum
Adolphi et al. 2014 Nature Geoscience
Changes in solar activity have previously been proposed to cause decadal- to millennial-scale fluctuations in both the modern and Holocene climates1. Direct observational records of solar activity, such as sunspot numbers, exist for only the past few hundred years, so solar variability for earlier periods is typically reconstructed from measurements of cosmogenic radionuclides such as 10Be and 14C from ice cores and tree rings. Here we present a high-resolution 10Be record from the ice core collected from central Greenland by the Greenland Ice Core Project (GRIP). The record spans from 22,500 to 10,000 years ago, and is based on new and compiled data. Using 14C records to control for climate-related influences on 10Be deposition, we reconstruct centennial changes in solar activity. We find that during the Last Glacial Maximum, solar minima correlate with more negative d18O values of ice and are accompanied by increased snow accumulation and sea-salt input over central Greenland. We suggest that solar minima could have induced changes in the stratosphere that favour the development of high-pressure blocking systems located to the south of Greenland, as has been found in observations and model simulations for recent climate. We conclude that the mechanism behind solar forcing of regional climate change may have been similar under both modern and Last Glacial Maximum climate conditions.
Rotation of the Earth, solar activity and cosmic ray intensity
Barlyaeva et al. 2014 Ann. Geophys. 32, 761-771
We analyse phase lags between the 11-year variations of three records: the semi-annual oscillation of the length of day (LOD), the solar activity (SA) and the cosmic ray intensity (CRI). The analysis was done for solar cycles 20-23. Observed relationships between LOD, CRI and SA are discussed separately for even and odd solar cycles. Phase lags were calculated using different methods (comparison of maximal points of cycles, maximal correlation coefficient, line of synchronization of cross-recurrence plots). We have found different phase lags between SA and CRI for even and odd solar cycles, confirming previous studies. The evolution of phase lags between SA and LOD as well as between CRI and LOD shows a positive trend with additional variations of phase lag values. For solar cycle 20, phase lags between SA and CRI, between SA and LOD, and between CRI and LOD were found to be negative. Overall, our study suggests that, if anything, the length of day could be influenced by solar irradiance rather than by cosmic rays.
On the detection of the solar signal in the tropical stratosphere
Chiodo et al. 2014 Atmos. Chem. Phys. 14, 5251-5269
We investigate the relative role of volcanic eruptions, El Niño-Southern Oscillation (ENSO), and the quasi-biennial oscillation (QBO) in the quasi-decadal signal in the tropical stratosphere with regard to temperature and ozone commonly attributed to the 11 yr solar cycle. For this purpose, we perform transient simulations with the Whole Atmosphere Community Climate Model forced from 1960 to 2004 with an 11 yr solar cycle in irradiance and different combinations of other forcings. An improved multiple linear regression technique is used to diagnose the 11 yr solar signal in the simulations. One set of simulations includes all observed forcings, and is thereby aimed at closely reproducing observations. Three idealized sets exclude ENSO variability, volcanic aerosol forcing, and QBO in tropical stratospheric winds, respectively. Differences in the derived solar response in the tropical stratosphere in the four sets quantify the impact of ENSO, volcanic events and the QBO in attributing quasi-decadal changes to the solar cycle in the model simulations. The novel regression approach shows that most of the apparent solar-induced lower-stratospheric temperature and ozone increase diagnosed in the simulations with all observed forcings is due to two major volcanic eruptions (i.e., El Chichon in 1982 and Mt. Pinatubo in 1991). This is caused by the alignment of these eruptions with periods of high solar activity. While it is feasible to detect a robust solar signal in the middle and upper tropical stratosphere, this is not the case in the tropical lower stratosphere, at least in a 45 yr simulation. The present results suggest that in the tropical lower stratosphere, the portion of decadal variability that can be unambiguously linked to the solar cycle may be smaller than previously thought.
Study of the influence of solar variability on a regional (Indian) climate: 1901-2007
Aslam and Badruddin 2014 Advances in Space Research
We use Indian temperature data of more than 100 years to study the influence of solar activity on climate. We study the Sun-climate relationship by averaging solar and climate data at various time scales; decadal, solar activity and solar magnetic cycles. We also consider the minimum and maximum values of sunspot number (SSN) during each solar cycle. This parameter SSN is correlated better with Indian temperature when these data are averaged over solar magnetic polarity epochs (SSN maximum to maximum). Our results indicate that the solar variability may still be contributing to ongoing climate change and suggest for more investigations.
Solar control on the cloud liquid water content and integrated water vapor associated with monsoon rainfall over India
Maitra et al. 2014 Journal of Atmospheric and Solar-Terrestrial Physics
A long-term observation over three solar cycles indicates a perceptible influence of solar activity on rainfall and associated parameters in the Indian region. This paper attempts to reveal the solar control on the cloud liquid water content (LWC) and integrated water vapor (IWV) along with Indian Summer Monsoon (ISM) rainfall during the period of 1977-2012 over nine different Indian stations. Cloud LWC and IWV are positively correlated with each other. An anti-correlation is observed between the Sunspot Number (SSN) and ISM rainfall for a majority of the stations and a poor positive correlation obtained for other locations. Cloud LWC and IWV possess positive correlations with Galactic Cosmic Rays (GCR) and SSN respectively for most of the stations. The wavelet analyses of SSN, ISM rainfall, cloud LWC and IWV have been performed to investigate the periodic characteristics of climatic parameters and also to indicate the varying relationship of solar activity with ISM rainfall, cloud LWC and IWV. SSN, ISM rainfall and IWV are found to have a peak at around 10.3 years whereas a dip is observed at that particular period for cloud LWC.
Reconstruction and prediction of the total solar irradiance: From the Medieval Warm Period to the 21st century
Herrera et al. 2014 New Astronomy 34, 221-233
Total solar irradiance is the primary energy source of the Earth's climate system and therefore its variations can contribute to natural climate change. This variability is characterized by, among other manifestations, decadal and secular oscillations, which has led to several attempts to estimate future solar activity. Of particular interest now is the fact that the behavior of the solar cycle 23 minimum has shown an activity decline not previously seen in past cycles for which spatial observations exist: this could be signaling the start of a new grand solar minimum. The estimation of solar activity for the next hundred years is one of the current problems in solar physics because the possible occurrence of a future grand solar minimum will probably have an impact on the Earth's climate. In this study, using the PMOD and ACRIM TSI composites, we have attempted to estimate the TSI index from year 1000 AD to 2100 AD based on the Least Squares Support Vector Machines, which is applied here for the first time to estimate a solar index. Using the wavelet transform, we analyzed the behavior of the total solar irradiance time series before and after the solar grand minima. Depending on the composite used, PMOD (or ACRIM), we found a grand minimum for the 21st century, starting in c. 2004c. 2004 (or 2002) and ending in c. 2075c. 2075 (or 2063), with an average irradiance of 1365.5 (or 1360.5) Wm-2+-1sd=0.3Wm-2+-1sd=0.3 (or 0.9) Wm-2Wm-2. Moreover, we calculated an average radiative forcing between the present and the 21st century minima of c. -0.1c. -0.1 (or -0.2) Wm-2Wm-2, with an uncertainty range of -0.04-0.04 to -0.14-0.14 (or -0.12-0.12 to -0.33-0.33) Wm-2Wm-2. As an indicator of the TSI level, we calculated its annual power anomalies; in particular, future solar cycles from 24 to 29 have lower power anomalies compared to the present, for both models. We also found that the solar activity grand minima periodicity is of 120 years; this periodicity could possibly be one of the principal periodicities of the magnetic solar activity not so previously well recognized. The negative (positive) 120-year phase coincides with the grand minima (maxima) of the 11-year periodicity.
Solar cycle effects on Indian summer monsoon dynamics
Ratnam et al. 2014 Journal of Atmospheric and Solar-Terrestrial Physics
Solar activity associated with sunspot number influences the atmospheric circulation on various time scales. As Indian summer monsoon (ISM) is the manifestation between warmer Asian continent and the cooler Indian Ocean, changes in the solar cycle are expected to influence the ISM characteristics. Among several elements of ISM, Tropical Easterly Jet (TEJ), Low Level Jet (LLJ), and rainfall are important features. As a part of CAWSES India Phase II theme 1 (solar influence on climate (0-100 km)) programme, we made an attempt to investigate the role of solar cycle variability on these ISM features using long-term data available from NECP/NCAR (1948-2010) and ERA-Interim (1979-2010) re-analysis products. To check the suitability of these data sets, ground based observations available over the Indian region are also considered. ISM characteristics are studied separately for the maximum and minimum as well as increasing and decreasing solar cycle conditions. Amplitudes corresponding to the solar cycle observed in TEJ, LLJ and rainfall are extracted using advanced statistical tool known as intrinsic mode function. Long-term trends in TEJ reveal decreasing trend at the rate of 0.13 m/s/yr (between 1948 and 2000) and no perceptible trend in LLJ. There exists inverse relation between TEJ strength and Central India rainfall. Large difference of 2 m/s (5 m/s) in the zonal winds of TEJ between solar maximum and minimum (increasing and decreasing trend) is noticed. There exists a difference of c. 2 m/s in LLJ winds between solar maximum and minimum and increasing and decreasing trend of the solar cycle. However, no consistent relation between the ISM rainfall and solar cycle is noticed over Indian region unlike reported earlier but there exists a delayed effect around 13 years. We attribute the observed features as linear and non-linear relation between dynamics of ISM, rainfall and solar cycle, respectively.
Diurnal tide in the low-latitude troposphere and stratosphere: Long-term trends and role of the extended solar minimum
Ratnam et al. 2014 Journal of Atmospheric and Solar-Terrestrial Physics
In the present study, long-term trends in the diurnal tide in the troposphere and stratosphere over a tropical station Gadanki (13.5 N, 79.2 E) are investigated using ERA-Interim wind and temperature products available since 1979. Suitability of the ERA-Interim data for the present study is ascertained using simultaneous radiosonde and MST radar observations over Gadanki and good consistency was found between the two. In general, diurnal tide amplitudes are found to increase from troposphere to stratosphere, as expected. Amplitude of the diurnal tide shows a long-term linear increasing trend, which becomes prominent in the stratosphere. Interestingly, convection over Gadanki also exhibits an increasing trend suggesting that they are related. Role of solar cycle on the diurnal tide is investigated by separating the tidal amplitudes during minimum and maximum of solar cycles 21, 22 and 23. Significantly higher amplitudes in the recent extended solar minimum are noticed though no consistent relation is found between solar activity and tides, in general. These results are discussed in the light of role of convection on the generation of the diurnal tide and their propagation to the higher altitudes, coupling lower and middle atmospheres. Special emphasis is made on the observed large amplitudes of the diurnal tide in the extended solar minimum while relating the observed changes to the background circulation.
Reconstructing the Holocene geomagnetic field
Korte et al. 2011 Earth and Planetary Science Letters 312, 497-505
Knowledge of the Holocene evolution of Earth's magnetic field is important for understanding geodynamo processes in the core, is necessary for studying long-term solar-terrestrial relationships, and can provide useful age constraints for archeologicaland stratigraphic applications. Continuous time-varying global field models based on archeo- and paleomagnetic data are useful tools in this regard. We use a comprehensive data compilation and recently refined modelling strategies to produce CALS10k.1b, the first time-varying spherical harmonic geomagnetic field model spanning 10 ky. The model is an average obtained from bootstrap sampling to take account of uncertainties in magnetic components and ages in the data (and hence has version number 1b instead of 1). This model shows less spatial and temporal resolution than earlier versions for 0-3 ka, and particularly aims to provide a robust representation of the large-scale field at the core-mantle boundary (CMB). We discuss the geomagnetic dipole evolution and changes in Holocene magnetic field morphology at the CMB as shown by the new reconstruction. The results are compatible with earlier models (CALS3k.3 and CALS3k.4) for 0-3 ka, but reveal some clear deficiencies in the 0-7 ka CALS7K.2 model prior to 3 ka. CALS10k.1b is able to resolve mobile and structurally-evolving high latitude radial field flux lobes at the CMB in both hemispheres, as well as persistent non-zonal structure, in the 10 ky average. Contributions to the average field from time-varying structures in the equatorial Indonesian-Australian region are particularly striking.
Investigations of temporal changes in climate and the geomagnetic field via high-resolution radiocarbon dating
Mellström, 2014 PhD thesis, Lund University
Geological archives have shown periods of abrupt climate change in the relatively stable Holocene epoch (last ca. 11 700 years). One of these periods was around 2800 cal BP. Several records, mainly from Europe, reveal a shift towards wetter, cooler and windier conditions. There are, however, indications for a global extent of the climate change. The climate change coincides with a distinct increase in the atmospheric radiocarbon (14C) concentration, which has been interpreted to be a result of decreased solar activity. Therefore, a solar-induced climate change has been suggested. In addition to changes in solar activity, geomagnetic field records also show prominent variations around 3000-2000 cal BP. In order to investigate the temporal... [see url for more of the abstract]
Stationarity of extreme bursts in the solar wind
Moloney and Davidsen 2014 Physical Review E
Recent results have suggested that the statistics of bursts in the solar wind vary with solar cycle. Here, we show that this variation is basically absent if one considers extreme bursts. These are defined as threshold-exceeding events over the range of high thresholds for which their number decays as a power law. In particular, we find that the distribution of duration times and energies of extreme bursts in the solar wind e parameter and similar observables are independent of the solar cycle and in this sense stationary, and show robust asymptotic power laws with exponents that are independent of the specific threshold. This is consistent with what has been observed for solar flares and, thus, provides evidence in favor of a link between solar flares and extreme bursts in the solar wind.
Spatial distribution of northern hemisphere temperatures during different phases of the solar cycle
Maliniemi et al 2014 Journal of Geophysical Research: Atmospheres
Several recent studies have found variability in the Northern Hemisphere winter climate related to different parameters of solar activity. While these results consistently indicate some kind of solar modulation of tropospheric and stratospheric circulation and surface temperature, opinions on the exact mechanism and the solar driver differ. Proposed drivers include, e.g., total solar irradiance (TSI), solar UV radiation, galactic cosmic rays and magnetospheric energetic particles. While some of these drivers are difficult to distinguish because of their closely similar variation over the solar cycle, other suggested drivers have clear differences in their solar cycle evolution. For example, geomagnetic activity and magnetospheric particle fluxes peak in the declining phase of the sunspot cycle, in difference to TSI and UV radiation which more closely follow sunspots. Using 13 solar cycles (1869-2009) we study winter surface temperatures and North Atlantic oscillation (NAO) during four different phases of the sunspot cycle: minimum, ascending, maximum and declining phase. We find significant differences in the temperature patterns between the four cycle phases, which indicates a solar cycle modulation of winter surface temperatures. However, the clearest pattern of the temperature anomalies is not found during sunspot maximum or minimum, but during the declining phase, when the temperature pattern closely resembles the pattern found during positive NAO. Moreover, we find the same pattern during the low sunspot activity cycles of 100 years ago, suggesting that the pattern is largely independent of the overall level of solar activity.
Galactic cosmic rays flux and geomagnetic activity coupling with cloud covering in Abastumani
Todua and Didebulidze 2013 Journal of the Georgian Geophysical Society, Issue B. Physics of Atmosphere, Ocean and Space Plasma, v.16b, 2013, pp 82-88
The analysis of long-term observations in Abastumani (41.75 N, 42.82 E) revealed differences in the seasonal variations of Galactic Cosmic Rays (GCRs) flux and geomagnetic activities at cloudless days and cloudless nights. Particularly, in summer, the inter-annual distributions of the planetary geomagnetic Ap index and Sudden Storm Commencement (SSC) exhibited minima for cloudless days and maxima for cloudless nights, where GCR flux showed deep minimum. This feature in the case of SSC was demonstrated for the first time. The long-term trends of Ap index during summer time also revealed various meanings for cloudless day and night. These results can be regarded as the effect of cosmic factors on cloud covering in Abastumani, which in turn may have an influence on climatic variations.
A 2700 cal yr BP extreme flood event revealed by sediment accumulation in Amazon floodplains
Moreira-Turcq et al. in press Palaeogeography, Palaeoclimatology, Palaeoecology
Climatic conditions are one of the most important factors affecting hydrological processes in fluvial systems. Higher discharges are responsible for higher erosion, greater transport, and also higher deposition. Consequently, sediment accumulation in Amazonia floodplain river-connected lakes can be directly related to hydrological patterns of the Amazon River mainstream. In this context, we analyzed five sediment cores taken in two floodplain systems situated in the lower Amazon River, to investigate sediment accumulation patterns during the Holocene. Our records show abrupt fluctuations in sedimentation rates in lakes that can reach more than 2 cm/yr during some periods. We find that in all cores, sediment stratigraphy is characterized by packages of sediments of uniform age, which are typically 10-80 cm thick and present a variegated color. The 14C age of the upper package is about 2700 cal yr BP. During this abrupt event, sediment accumulation rates in floodplain lakes can be at least 200 times higher than those of "normal" periods. This sedimentation event is interpreted as being the consequence of one or several successive extreme floods. The 2700 cal yr BP event has been also observed in other sites in South America and other regions in the world, although different impacts can be observed in each system. This event probably corresponds to a conjunction of favorable conditions for extreme Amazon discharge associated with the Middle to Late Holocene increase of austral summer insolation and shifts of the Intertropical Convergence Zone (ITCZ) from northern to southern positions. In this context, a marked negative peak in solar irradiance at 2700 cal yrs BP seems to have provoked cooling on the continents and a southward shift of the ITCZ associated with a probable reduction in Atlantic Meridian Overturning Circulation.
A History of Solar Activity over Millennia
Usoskin, 2008/2010/2013 [updated] Living Reviews in Solar Physics
Presented here is a review of present knowledge of the long-term behavior of solar activity on a multi-millennial timescale, as reconstructed using the indirect proxy method. The concept of solar activity is discussed along with an overview of the special indices used to quantify different aspects of variable solar activity, with special emphasis upon sunspot number. Over long timescales, quantitative information about past solar activity can only be obtained using a method based upon indirect proxy, such as the cosmogenic isotopes 14C and 10Be in natural stratified archives (e.g., tree rings or ice cores). We give an historical overview of the development of the proxy-based method for past solar-activity reconstruction over millennia, as well as a description of the modern state. Special attention is paid to the verification and cross-calibration of reconstructions. It is argued that this method of cosmogenic isotopes makes a solid basis for studies of solar variability in the past on a long timescale (centuries to millennia) during the Holocene. A separate section is devoted to reconstructions of strong solar-energetic-particle (SEP) events in the past, that suggest that the present-day average SEP flux is broadly consistent with estimates on longer timescales, and that the occurrence of extra-strong events is unlikely. Finally, the main features of the long-term evolution of solar magnetic activity, including the statistics of grand minima and maxima occurrence, are summarized and their possible implications, especially for solar/stellar dynamo theory, are discussed.
On the relationship between global land-ocean temperature and various descriptors of solar-geomagnetic activity and climate
Wilson 2014 NASA Technical Report, 62p
Examined are sunspot cycle- (SC-) length averages of the annual January-December values of the Global Land-Ocean Temperature Index (GLOTI) in relation to SC-length averages of annual values of various descriptors of solar-geomagnetic activity and climate, incorporating lags of 0-5 yr. For the overall interval SC12-SC23, the GLOTI is inferred to correlate best against the parameter aa(I:SSN) incorporating lag = 5 yr, where the parameter aa(I:SSN) refers to the resultant aa value having removed that portion of the annual aa average value due to the yearly variation of sunspot number (SSN). The inferred correlation between the GLOTI and aa(I:SSN) is statistically important at confidence level cl >99.9%, having a coefficient of linear correlation r = 0.865 and standard error of estimate se = 0.149 degC. Excluding the most recent cycles SC22 and SC23, the inferred correlation is stronger, having r = 0.969 and se = 0.048 degC. With respect to the overall trend in the GLOTI, which has been upwards towards warmer temperatures since SC12 (1878-1888), solar-geomagnetic activity parameters are now trending downwards (since SC19). For SC20-SC23, in contrast, comparison of the GLOTI against SC-length averages of the annual value of the Mauna Loa carbon dioxide (MLCO2>) index is found to be highly statistically important (cl >> 99.9%), having r = 0.9994 and se = 0.012 degC for lag = 2 yr. On the basis of the inferred preferential linear correlation between the GLOTI and MLCO2, the current ongoing SC24 is inferred to have GLOTI warmer than was seen in SC23 (i.e., >0.526 degC), probably in excess of 0.68 degC (relative to the 1951-1980 base period).
The asymmetry of the climate system's response to solar forcing changes and its implications for geoengineering scenarios
Schaller et al. 2014 Journal of Geophysical Research - Atmospheres
Motivated by proposals to compensate CO2-induced warming with a decrease in solar radiation, this study investigates how single-forcing simulations should be combined to best represent the spatial patterns of surface temperature and precipitation of idealized geoengineering scenarios. Using instantaneous and transient simulations with changing CO2 and solar forcings, we show that a geoengineering scenario, i.e., a scenario where the solar constant is reduced as CO2 concentrations are increased, is better represented by subtracting the response pattern of a solar forcing increase simulation from the response pattern of a CO2 forcing increase simulation, than by adding the response pattern of a solar forcing decrease simulation to a CO2 forcing increase simulation. The reason is a asymmetric response of the climate system to a forcing increase or decrease between both hemispheres. In particular, the Atlantic meridional overturning circulation responds faster to a solar forcing decrease compared to a solar forcing increase. Further, the climate feedbacks are state and region dependent, which is particularly apparent in the polar regions due to the sea ice-albedo feedback. The importance of understanding the local response of the climate system to geoengineering and single-forcing scenarios is highlighted, since these aspects are hardly discernible when only global mean values are considered.
Forcings and feedbacks in the GeoMIP ensemble for a reduction in solar irradiance and increase in CO2
Huneeus et al. 2014 Journal of Geophysical Research - Atmospheres
The effective radiative forcings (including rapid adjustments) and feedbacks associated with an instantaneous quadrupling of the preindustrial CO2 concentration and a counterbalancing reduction of the solar constant are investigated in the context of the Geoengineering Model Intercomparison Project (GeoMIP). The forcing and feedback parameters of the net energy flux, as well as its different components at the top-of-atmosphere (TOA) and surface, were examined in 10 Earth System Models to better understand the impact of solar radiation management on the energy budget. In spite of their very different nature, the feedback parameter and its components at the TOA and surface are almost identical for the two forcing mechanisms, not only in the global mean but also in their geographical distributions. This conclusion holds for each of the individual models despite intermodel differences in how feedbacks affect the energy budget. This indicates that the climate sensitivity parameter is independent of the forcing (when measured as an effective radiative forcing). We also show the existence of a large contribution of the cloudy-sky component to the shortwave effective radiative forcing at the TOA suggesting rapid cloud adjustments to a change in solar irradiance. In addition, the models present significant diversity in the spatial distribution of the shortwave feedback parameter in cloudy regions, indicating persistent uncertainties in cloud feedback mechanisms.
Mid- to Late-Holocene AustralianeIndonesian summer monsoon variability
Steinke et al. 2014 Quaternary Science Reviews 93, 142-154
The Australian-Indonesian monsoon has a governing influence on the agricultural practices and livelihood in the highly populated islands of Indonesia. However, little is known about the factors that have influenced past monsoon activity in southern Indonesia. Here, we present a c. 6000 years high-resolution record of Australian-Indonesian summer monsoon (AISM) rainfall variations based on bulk sediment element analysis in a sediment archive retrieved offshore northwest Sumba Island (Indonesia). The record suggests lower riverine detrital supply and hence weaker AISM rainfall between c. 6000 yr BP and 3000 yr BP compared to the Late Holocene. We find a distinct shift in terrigenous sediment supply at around 2800 yr BP indicating a reorganization of the AISM from a drier Mid Holocene to a wetter Late Holocene in southern Indonesia. The abrupt increase in rainfall at around 2800 yr BP coincides with a grand solar minimum. An increase in southern Indonesian rainfall in response to a solar minimum is consistent with climate model simulations that provide a possible explanation of the underlying mechanism responsible for the monsoonal shift. We conclude that variations in solar activity play a significant role in monsoonal rainfall variability at multi-decadal and longer timescales. The combined effect of orbital and solar forcing explains important details in the temporal evolution of AISM rainfall during the last 6000 years. By contrast, we find neither evidence for volcanic forcing of AISM variability nor for a control by long-term variations in the El Ninho-Southern Oscillation (ENSO).
Imprint of long-term solar signal in groundwater recharge fluctuation rates from Northwest China
Tiwari and Rajesh 2014 Geophysical Research Letters
Multiple spectral and statistical analyses of a 700 yearlong temporal record of groundwater recharge from the dry lands, Badain Jaran Desert (Inner Mongolia) of Northwest China reveal a stationary harmonic cycle at ~200 +- 20 year. Interestingly, the underlying periodicity in groundwater recharge fluctuations is similar to those of solar-induced climate cycle "Suess wiggles" and appears to be coherent with phases of the climate fluctuations and solar cycles. Matching periodicity of groundwater recharge rates and solar and climate cycles renders a strong impression that solar-induced climate signals may act as a critical amplifier for driving the underlying hydrographic cycle through the common coupling of long-term Sun-climate groundwater linkages.
Sunspot cycles recorded in Mesoproterozoic carbonate biolaminites
Tang et al. 2014 Precambian Research
Well-preserved carbonate biolaminites from the early Mesoproterozoic Wumishan Formation (ca. 1.5-1.45 Ga) of North China show submillimeter-scale yearly couplets that consist of alternating dark and light laminae, and are texturally similar to those reported from Holocene tufas. Power spectrum and wavelet transform analyses of laminar couplet thickness variations and geochemical series (Ca, Fe, Co/Ti, Cr/Ti, and Br) reveal a prominent periodicity at 9.0-11.7 and a less prominent periodicity at 19.7-21.4 couplets. These coherent periodic modes match well with the 11-yr Schwabe sunspot cycle and 22-yr solar Hale cycle. The observed layering pattern is thus interpreted as recording solar induced climate changes that may have modulated microbial growth rate and biomass production in restricted subtidal environments on a broad epicontinental platform. The documented example represents the first reported solar signature in Mesoproterozoic marine carbonates and implies the sensitivity of microbial life to environmental changes prior to metazoan evolution.
Response of the Bering Sea to 11-year solar irradiance cycles during the Bølling-Allerød
Katsuki et al. 2014 Geophysical Research Letters
Previous studies find decadal climate variability possibly related to solar activity, although the details regarding the feedback with the ocean environment and ecosystem remain unknown. Here, we explore the feedback system of solar irradiance change during the Bølling-Allerød period, based on laminated sediments in the northern Bering Sea. During this period, well-ventilated water was restricted to the upper intermediate layer, and oxygen-poor lower intermediate water preserved the laminated sediment. An 11-year cycle of diatom and radiolarian flux peaks was identified from the laminated interval. Increased fresh meltwater input and early sea-ice retreat in spring under the solar irradiance maximum follow the positive phase of Arctic Oscillation which impacted the primary production and volume of upper intermediate water production in the following winter. Strength of this 11 year solar irradiance effect might be further regulated by the pressure patterns of Pacific decadal oscillation and/or El Niño-Southern Oscillation variability.
Sensitivity of the surface temperature to changes in total solar irradiance calculated with the WRF model
Cipaguata et al. 2014 Geofisica Internacional 53
The temperature sensitivity of the WRF model to changes in Total Solar Irradiance (TSI). The simulations were performed for a region centered over the North Atlantic Ocean, including portions of Eastern North America, Western Europe and Northwest Africa. Four simulations were run with different TSI values. Also, a fifth simulation was performed in which we varied the initial atmospheric conditions, in order to compare the effect on the temperature of both, changes in the TSI and initial atmospheric conditions. Comparing temperature monthly averages we found that changes in TSI and in the initial conditions have a measurable impact on temperature in the region of study. The sensitivity of the model using non-dimensional parameters was also estimated. The numerical experiments show some features that might allow to distinguish between the effects on the temperature due to changes in TSI from those caused by initial conditions. However, TSI changes are of the same order of magnitude than those of disturbances in the initial conditions. We also found that the mean monthly values of temperature over the full grid, did not present significant variations due to changes of either initial conditions or TSI.
Effect of solar variations on particle formation and cloud condensation nuclei
Yu anda Luo 2014 Environmental Research Letters 9, 045004
The impact of solar variations on particle formation and cloud condensation nuclei (CCN), a critical step for one of the possible solar indirect climate forcing pathways, is studied here with a global aerosol model optimized for simulating detailed particle formation and growth processes. The effect of temperature change in enhancing the solar cycle CCN signal is investigated for the first time. Our global simulations indicate that a decrease in ionization rate associated with galactic cosmic ray flux change from solar minimum to solar maximum reduces annual mean nucleation rates, number concentration of condensation nuclei larger than 10 nm (CN10), and number concentrations of CCN at water supersaturation ratio of 0.8% (CCN0.8) and 0.2% (CCN0.2) in the lower troposphere by 6.8%, 1.36%, 0.74%, and 0.43%, respectively. The inclusion of 0.2 C temperature increase enhances the CCN solar cycle signals by around 50%. The annual mean solar cycle CCN signals have large spatial and seasonal variations: (1) stronger in the lower troposphere where warm clouds are formed, (2) about 50% larger in the northern hemisphere than in the southern hemisphere, and (3) about a factor of two larger during the corresponding hemispheric summer seasons. The effect of solar cycle perturbation on CCN0.2 based on present study is generally higher than those reported in several previous studies, up to around one order of magnitude.
Seasonal temperature variability of the Neoglacial (3300-2500 BP) and Roman Warm Period (2500-1600 BP) reconstructed from oxygen isotope ratios of limpet shells (Patella vulgata), Northwest Scotland
Wang et al. 2012 Palaeogeography, Palaeoclimatology, Palaeoecology 317-318, 104-113
Seasonal sea-surface temperature variability for the Neoglacial (3300-2500 BP) and Roman Warm Period (RWP; 2500-1600 BP), which correspond to the Bronze and Iron Ages, respectively, was estimated using oxygen isotope ratios obtained from high-resolution samples micromilled from radiocarbon-dated, archaeological limpet (Patella vulgata) shells. The coldest winter months recorded in Neoglacial shells averaged 6.6 +- 0.3 C, and the warmest summer months averaged 14.7 +- 0.4 C. One Neoglacial shell captured a year without a summer, which may have resulted from a dust veil from a volcanic eruption in the Katla volcanic system in Iceland. RWP shells record average winter and summer monthly temperatures of 6.3 +- 0.1 C and 13.3 +- 0.3 C, respectively. These results capture a cooling transition from the Neoglacial to RWP, which is further supported by earlier studies of pine history in Scotland, pollen type analyses in northeast Scotland, and European glacial events. The cooling transition observed at the boundary between the Neoglacial and RWP in our study also agrees with the abrupt climate deterioration at 2800-2700 BP (also referred to as the Subboreal/Subatlantic transition) and therefore may have been driven by decreased solar radiation and weakened North Atlantic Oscillation conditions.
Ocean-atmosphere climate shift during the mid-to-late Holocene transition
Morley et al. 2014 Earth and Planetary Science Letters
Climate records of the mid-to-late Holocene transition, between 3-4 thousand years before present (ka), often exhibit a rapid change in response to the gradual change in orbital insolation. Here we investigate North Atlantic Central Water circulation as a possible mechanism regulating the latitudinal temperature gradient (LTG), which, in turn, amplifies climate sensitivity to small changes in solar irradiance. Through this mechanism, sharp climate events and transitions are the result of a positive feedback process that propagates and amplifies climate events in the North Atlantic region. We explore these linkages using an intermediate water temperature record reconstructed from Mg/Ca measurements of benthic foraminifera (Hyalinea balthica) from a sediment core off NW Africa (889 m depth) between 0 to 5.5 ka. Our results show that Eastern North Atlantic Central Waters (ENACW) cooled by c1 +- 0.7 C and densities decreased by dtheta = 0.4 +- 0.2 between 3.3 and 2.6 ka. This shift in ENACW hydrography illustrates a transition towards enhanced mid-latitude atmospheric circulation after 2.7 ka in particular during cold events of the late-Holocene. The presented records demonstrate the important role of ENACW circulation in propagating the climate signatures of the LTG by reducing the meridional heat transfer from high to low latitudes during the transition from the Holocene Thermal Maximum to the late-Holocene. In addition, the dynamic response of ENACW circulation to the gradual climate forcing of LTGs provides a prime example of an amplifying climate feedback mechanism.
Solar forcing of North Atlantic surface temperature and salinity over the past millennium
Moffa-Sánchez et al. 2014 Nature Geoscience
There were several centennial-scale fluctuations in the climate and oceanography of the North Atlantic region over the past 1,000 years, including a period of relative cooling from about AD 1450 to 1850 known as the Little Ice Age. These variations may be linked to changes in solar irradiance, amplified through feedbacks including the Atlantic meridional overturning circulation. Changes in the return limb of the Atlantic meridional overturning circulation are reflected in water properties at the base of the mixed layer south of Iceland. Here we reconstruct thermocline temperature and salinity in this region from AD 818 to 1780 using paired d18O and Mg/Ca ratio measurements of foraminifer shells from a subdecadally resolved marine sediment core. The reconstructed centennial-scale variations in hydrography correlate with variability in total solar irradiance. We find a similar correlation in a simulation of climate over the past 1,000 years. We infer that the hydrographic changes probably reflect variability in the strength of the subpolar gyre associated with changes in atmospheric circulation. Specifically, in the simulation, low solar irradiance promotes the development of frequent and persistent atmospheric blocking events, in which a quasi-stationary high-pressure system in the eastern North Atlantic modifies the flow of the westerly winds. We conclude that this process could have contributed to the consecutive cold winters documented in Europe during the Little Ice Age.
The Little Ice Age signature and subsequent warming seen in borehole temperature logs versus solar forcing model
Majorowicz et al. 2014 Int J Earth Sci
The 'low' in the transient temperature versus depth borehole profiles around 120 m seen from deep temperature logs in the Canadian Prairies (southern Alberta-southern Saskatchewan), as well as in some of the European data, has been interpreted to be related to the Little Ice Age (LIA). Data point to the lowest ground surface and subsurface temperatures occurring in the very late eighteenth to nineteenth centuries. Inversion of these logs shows that surface temperature lows were followed by a recent warming period. Further, the synthetic profiles built on the basis of solar forcing history, stretching as far back as the beginning of the seventeenth century, suggest that the LIA signatures interpreted from the inversion of the borehole temperature logs would be difficult to be explained by known published models of past solar irradiation despite large range of assumed sensitivities for the couplings assumed, and that further forcing needs to be considered.
Evidence for external forcing of the Atlantic Multidecadal Oscillation since termination of the Little Ice Age
Knudsen et al. 2014 Nature Communications 5, 3323
The Atlantic Multidecadal Oscillation (AMO) represents a significant driver of Northern Hemisphere climate, but the forcing mechanisms pacing the AMO remain poorly understood. Here we use the available proxy records to investigate the influence of solar and volcanic forcing on the AMO over the last c. 450 years. The evidence suggests that external forcing played a dominant role in pacing the AMO after termination of the Little Ice Age (LIA; ca. 1400-1800), with an instantaneous impact on mid-latitude sea-surface temperatures that spread across the North Atlantic over the ensuing c.5 years. In contrast, the role of external forcing was more ambiguous during the LIA. Our study further suggests that the Atlantic Meridional Overturning Circulation is important for linking external forcing with North Atlantic sea-surface temperatures, a conjecture that reconciles two opposing theories concerning the origin of the AMO.
The Impact of Different Absolute Solar Irradiance Values on Current Climate Model Simulations
Rind et al. 2013 J. Climate 27, 1100-1120
Simulations of the preindustrial and doubled CO2 climates are made with the GISS Global Climate Middle Atmosphere Model 3 using two different estimates of the absolute solar irradiance value: a higher value measured by solar radiometers in the 1990s and a lower value measured recently by the Solar Radiation and Climate Experiment. Each of the model simulations is adjusted to achieve global energy balance; without this adjustment the difference in irradiance produces a global temperature change of 0.4°C, comparable to the cooling estimated for the Maunder Minimum. The results indicate that by altering cloud cover the model properly compensates for the different absolute solar irradiance values on a global level when simulating both preindustrial and doubled CO2 climates. On a regional level, the preindustrial climate simulations and the patterns of change with doubled CO2 concentrations are again remarkably similar, but there are some differences. Using a higher absolute solar irradiance value and the requisite cloud cover affects the model's depictions of high-latitude surface air temperature, sea level pressure, and stratospheric ozone, as well as tropical precipitation. In the climate change experiments it leads to an underestimation of North Atlantic warming, reduced precipitation in the tropical western Pacific, and smaller total ozone growth at high northern latitudes. Although significant, these differences are typically modest compared with the magnitude of the regional changes expected for doubled greenhouse gas concentrations. Nevertheless, the model simulations demonstrate that achieving the highest possible fidelity when simulating regional climate change requires that climate models use as input the most accurate (lower) solar irradiance value.
The solar influence on the probability of relatively cold UK winters in the future
Lockwood et al. 2011 Environ. Res. Lett. 6 034004
Recent research has suggested that relatively cold UK winters are more common when solar activity is low (Lockwood et al 2010 Environ. Res. Lett. 5 024001). Solar activity during the current sunspot minimum has fallen to levels unknown since the start of the 20th century (Lockwood 2010 Proc. R. Soc. A 466 303-29) and records of past solar variations inferred from cosmogenic isotopes (Abreu et al 2008 Geophys. Res. Lett. 35 L20109) and geomagnetic activity data (Lockwood et al 2009 Astrophys. J. 700 937-44) suggest that the current grand solar maximum is coming to an end and hence that solar activity can be expected to continue to decline. Combining cosmogenic isotope data with the long record of temperatures measured in central England, we estimate how solar change could influence the probability in the future of further UK winters that are cold, relative to the hemispheric mean temperature, if all other factors remain constant. Global warming is taken into account only through the detrending using mean hemispheric temperatures. We show that some predictive skill may be obtained by including the solar effect.
Solar cycle modulation of the Pacific-North American teleconnection influence on North American winter climate
Liu et al. 2014 Environ. Res. Lett. 9 024004
We investigate the role of the 11-year solar cycle in modulating the Pacific-North American (PNA) influence on North American winter climate. The PNA appears to play an important conduit between solar forcing and surface climate. The low solar (LS) activity may induce an atmospheric circulation pattern that resembles the positive phase of the PNA, resulting in a significant warming over northwestern North America and significant dry conditions in the Pacific Northwest, Canadian Prairies and the Ohio-Tennessee-lower Mississippi River Valley. The solar-induced changes in surface climate share more than 67% and 14% of spatial variances in the PNA-induced temperature and precipitation changes for 1950-2010 and 1901-2010 periods, respectively. These distinct solar signatures in North American climate may contribute to deconvolving modern and past continental-scale climate changes and improve our ability to interpret paleoclimate records in the region.
Interactions between externally forced climate signals from sunspot peaks and the internally generated Pacific Decadal and North Atlantic Oscillations
van Loon and Meehl 2013 Geophysical Research Letters
When the Pacific Decadal Oscillation is in phase with the 11 year sunspot cycle, there are positive sea level pressure (SLP) anomalies in the Gulf of Alaska, nearly no anomalous zonal SLP gradient across the equatorial Pacific, and a mix of small positive and negative sea surface temperature (SST) anomalies there. When the two indices are out of phase, positive SLP anomalies extend farther south in the Gulf of Alaska and west into eastern Russia, with a strengthened anomalous zonal equatorial Pacific SLP gradient and larger magnitude and more extensive negative SST anomalies along the equatorial Pacific. In the North Atlantic, when the North Atlantic Oscillation (NAO) is in phase with the sunspot peaks, there is an intensified positive NAO SLP pattern. When the NAO is out of phase with the peaks, there is the opposite pattern (negative NAO). The relationships are physically consistent with previously identified processes and mechanisms and point the way to further research.
Possible effect of strong solar energetic particle events on polar stratospheric aerosol: a summary of observational results
Mironova and Usoskin 2014 Environmental Research Letters 9, 015002 This letter presents a summary of a phenomenological study of the response of the polar stratosphere to strong solar energetic particle (SEP) events corresponding to ground level enhancements (GLEs) of cosmic rays. This work is focused on evaluation of the possible influence of the atmospheric ionization caused by SEPs upon formation of aerosol particles in the stratosphere over polar regions. Following case studies of two major SEP/GLE events, in January 2005 and September 1989, and their possible effects on polar stratospheric aerosols, we present here the results of an analysis of variations of the daily profiles of the stratospheric aerosol parameters (aerosol extinction for different wavelengths, as well as Angstrom exponent) for both polar hemispheres during SEP/GLE events of July 2000, April 2001 and October 2003, which form already five clear cases corresponding to extreme and strong SEP/GLE events. The obtained results suggest that an enhancement of ionization rate by a factor of about two in the polar region with night/cold/winter conditions can lead to the formation/growing of aerosol particles in the altitude range of 10-25 km. We also present a summary of the investigated effects based on the phenomenological study of the atmospheric application of extreme SEP events.
The nature of the solar activity during the Maunder Minimum revealed by the Guliya ice core record
Linglian et al 2000 Chinese Science Bulletin 45, 2118-2125
Whether the solar activity was very low, and especially whether the solar cycle existed, during the Maunder Minimum (1645-1715 AD), have been disputed for a long time. In this paper we use the Guliya NO3 data, which can reflect the solar activity, to analyze the characteristics of the solar activity during the Maunder Minimum. The results show that the solar activity was indeed low, and solar cycle displayed normal as present, i.e. about 11a, in that period. Moreover, it was found that the solar activity contains a 36-year periodic component probably, which might be related to the variations in the length of the sunspot cycle. This finding is of importance for the study of the relationship between the sun variability and the Earth climate change.
Influence of the Precipitating Energetic Particles on Atmospheric Chemistry and Climate
Rozanov et al. 2012 Surveys in Geophysics 33, 483-501
Abstract We evaluate the influence of the galactic cosmic rays (GCR), solar proton events (SPE), and energetic electron precipitation (EEP) on chemical composition of the atmosphere, dynamics, and climate using the chemistry-climate model SOCOL. We have carried out two 46-year long runs. The reference run is driven by a widely employed forcing set and, for the experiment run, we have included additional sources of NOx and HOx caused by all considered energetic particles. The results show that the effects of the GCR, SPE, and EEP fluxes on the chemical composition are most pronounced in the polar mesosphere and upper stratosphere; however, they are also detectable and statistically significant in the lower atmosphere consisting of an ozone increase up to 3 % in the troposphere and ozone depletion up to 8 % in the middle stratosphere. The thermal effect of the ozone depletion in the stratosphere propagates down, leading to a warming by up to 1 K averaged over 46 years over Europe during the winter season. Our results suggest that the energetic particles are able to affect atmospheric chemical composition, dynamics, and climate.
Possible effects of atmospheric teleconnections and solar variability on tropospheric and stratospheric temperatures in the Northern Hemisphere
Sfica and Voiculescu 2014 Journal of Atmospheric and Solar-Terrestrial Physics
Possible relationships between tropospheric and stratospheric temperatures in the Northern Hemisphere and atmospheric oscillations, solar and geomagnetic activity are described using correlation analysis. The dependence of correlations on season, solar activity level and phase of the Quasi Biennial Oscillation (QBO) is also investigated. An important finding is that the variability of the hemispheric tropospheric temperature is well connected to the Scandinavian Pattern, to the Pacific North American teleconnection and less with the North Atlantic Oscillation. There is also a possible link with the Southern Oscillation (SO) for winter. Solar UV and cosmic ray flux might influence tropospheric temperature during warm seasons, solar maximum or QBO West. Significant correlations between the Northern stratospheric temperature and the SO is observed especially during the Eastern phase of QBO and solar minimum. Signatures of geomagnetic variability are seen in the winter stratospheric temperature. The stratospheric temperature correlates with the cosmic ray flux and solar UV at annual level at solar maximum and QBO West. The UV effect at stratospheric level is less clear than expected. The existence of some correlations between tropospheric/stratospheric temperatures and internal and external parameters under certain climatic circumstances and during different solar cycle phases might help in identifying processes that transfer energy from the Sun to different atmospheric layers and in assessing their role in climate variability.
Reduced Solar Activity Disguises Global Temperature Rise
Stauning 2014 Atmospheric and Climate Sciences, 2014, 4, 60-63
The question whether human activities seriously affect climate is asked with increasing voice these days. Quite understandable since the climate appears to be out of control with the significant global temperature increases already seen during the last three decades and with still heavier temperature increases to come in the future according to prognoses, among others, in the recent comprehensive IPCC reports [1]. However, the most recent climate data [2], show global temperature development levelling off or even turning negative since 2001 in contrast to the anticipated course related to the steady increases in the concentration in the atmosphere of green-house gasses, primarily carbon dioxide and methane [1]. The purpose of this communication is to demonstrate that the reduced rate in the global temperature rise complies with expectations related to the decaying level of solar activity according to the relation published in an earlier analysis [3]. Without the reduction in the solar activity-related contributions the global temperatures would have increased steadily from 1980 to present.
The effects of solar irradiation changes on the migration of the Congo Air Boundary and water levels of paleo-Lake Suguta, Northern Kenya Rift, during the African Humid Period (15-5 ka BP)
Junginger et al. 2014 Palaeogeography, Palaeoclimatology, Palaeoecology
The water-level record from the 300 m deep paleo-lake Suguta (Northern Kenya Rift) during the African Humid Period (AHP, 15-5 ka BP) helps to explain decadal to centennial intensity variations in the West African Monsoon (WAM) and the Indian Summer Monsoon (ISM). This water-level record was derived from three different sources: (1) grainsize variations in radiocarbon dated and Rreservoir corrected lacustrine sediments, (2) the altitudes and ages of paleo-shorelines within the basin, and (3) the results of hydro-balance modeling, providing S important insights into the character of water level variations (abrupt or gradual) in the amplifier paleo-Lake Suguta. The results of this comprehensive analyses suggest that the AHP N highstand in the Suguta Valley was the direct consequence of a northeastwards shift in the Congo Air Boundary (CAB), which was in turn caused by an enhanced atmospheric pressure gradient between East Africa and India during a northern hemisphere insolation maximum. Rapidly decreasing water levels of up to 90 m over less than a hundred years are best explained by changes in solar irradiation either reducing the East African-Indian atmospheric pressure P gradient and preventing the CAB from reaching the study area, or reducing the overall humidity in the atmosphere, or a combination of both these effects. In contrast, although not well documented C in our record we hypothesize a gradual end of the AHP despite an abrupt change in the source of precipitation when a decreasing pressure gradient between Asia and Africa prevented the CAB from reaching the Suguta Valley. The abruptness was probably buffered by a contemporaneous change in precession producing an insolation maximum at the equator during October. Whether or not this is the case, the water-level record from the Suguta Valley demonstrates the importance of both orbitally-controlled insolation variations and short-term changes in solar irradiation as factors affecting the significant water level variations in East African rift lakes.
Clouds blown by the solar wind
Voiculescu et al. 2013 Environ. Res. Lett. 8, 045032
In this letter we investigate possible relationships between the cloud cover (CC) and the interplanetary electric field (IEF), which is modulated by the solar wind speed and the interplanetary magnetic field. We show that CC at mid-high latitudes systematically correlates with positive IEF, which has a clear energetic input into the atmosphere, but not with negative IEF, in general agreement with predictions of the global electric circuit (GEC)-related mechanism. Thus, our results suggest that mid-high latitude clouds might be affected by the solar wind via the GEC. Since IEF responds differently to solar activity than, for instance, cosmic ray flux or solar irradiance, we also show that such a study allows distinguishing one solar-driven mechanism of cloud evolution, via the GEC, from others.
Global warming and solar anomaly
Chakrabarty and Peshin 2013 Indian Journal of Radio & Space Physics
During 2002-2008, there was no increase in global temperature, though green house gas concentrations had increased. Sun is the ultimate source of energy. It has been, therefore, examined if there was any anomaly in the solar characteristics during this period. The sunspot number data has been used for this purpose. This parameter has an 11-year solar activity cycle and the same is found in the global temperature. But the trend in sun's output, after removing solar activity effect, does not match with the long term trend of global temperature. Peculiarities in the duration and in the peak value of solar cycle 23 were identified which might have portended the increase of global temperature during 2002-2008. The possibility of the pause of increase in temperature could also be that the heat generated due to the increase in the greenhouse gas concentration was absorbed in deep ocean layer.
papers reported in 2013
Small influence of solar variability on climate over the past millennium
Schurer et al. 2013 Nature Geoscience
The climate of the past millennium was marked by substantial decadal and centennial scale variability in the Northern Hemisphere. Low solar activity has been linked to cooling during the Little Ice Age (AD 1450-1850) and there may have been solar forcing of regional warmth during the Medieval Climate Anomaly (AD 950-1250). The amplitude of the associated changes is, however, poorly constrained, with estimates of solar forcing spanning almost an order of magnitude. Numerical simulations tentatively indicate that a small amplitude best agrees with available temperature reconstructions. Here we compare the climatic fingerprints of high and low solar forcing derived from model simulations with an ensemble of surface air temperature reconstructions for the past millennium. Our methodology also accounts for internal climate variability and other external drivers such as volcanic eruptions, as well as uncertainties in the proxy reconstructions and model output. We find that neither a high magnitude of solar forcing nor a strong climate effect of that forcing agree with the temperature reconstructions. We instead conclude that solar forcing probably had a minor effect on Northern Hemisphere climate over the past 1,000 years, while, volcanic eruptions and changes in greenhouse gas concentrations seem to be the most important influence over this period.
Deep Solar Activity Minima, Sharp Climate Changes, and Their Impact on Ancient Civilizations
Raspopov et al. 2013 Geomagnetism and Aeronomy 53, 917-92
It is shown that, over the past c. 10000 years (the Holocene), deep Maunder type solar minima have been accompanied by sharp climate changes. These minima occurred every 2300-2400 years. It has been established experimentally that, at ca 4.0 ka BP, there occurred a global change in the structure of atmospheric circulation, which coincided in time with the discharge of glacial masses from Greenland to North Atlantic and a solar activity minimum. The climate changes that took place at ca 4.0 ka BP and the deep solar activity minimum that occurred at ca 2.5 ka BP affected the development of human society, leading to the degradation and destruction of a number of ancient civilizations.
Late Holocene ecohydrological and carbon dynamics of a UK raised bog: impact of human activity and climate change
Turner et al. 2014 Quaternary Science Reviews
Understanding the ecohydrological responses of peatlands to climate change is particularly challenging over the late Holocene owing to the confounding influence of anthropogenic activity. To address this, a core spanning the last c. 2400 years from a raised bog in northern England was analysed using a comprehensive suite of proxy methods in an attempt to elucidate the drivers of change. A testate amoebae-based transfer function was used to quantitatively reconstruct changes in water table depth, supported by humification analysis and a plant macrofossil-derived hydroclimatic index. Pollen and plant macrofossil data were used to examine regional and local vegetation change, and human impacts were inferred from charcoal and geochemistry. Chronological control was achieved through a Bayesian age-depth model based on AMS radiocarbon dates and spheroidal carbonaceous particles, from which peat and carbon accumulation rates were calculated. Phases of both increased and decreased bog surface wetness (inferred effective precipitation) are present, with dry phases at c. AD 320-830, AD 920-1190 and AD 1850-present, and a marked period of increased effective precipitation at c. AD 1460-1850. Coherence with other records from across Northern Europe suggests that these episodes are primarily driven by allogenic climatic change. Periods of high bog surface wetness correspond to the Wolf, Sporer and Maunder sunspot activity minima, suggesting solar forcing was a significant driver of climate change over the last c. 1000 years. Following the intensification of agriculture and industry over the last two centuries, the combined climatic and anthropogenic forcing effects become increasingly difficult to separate due to increases in atmospheric deposition of anthropogenically derived pollutants, fertilising compounds, and additions of wind-blown soil dust. We illustrate the need for multiproxy approaches based on high-resolution palaeoecology and geochemistry to examine the recent trajectories of peatlands.
The role of the oceans in shaping the tropospheric response to the 11 year solar cycle
Misios and Schmidt 2014 Geophysical Research Letters
Observational data indicate a weakening and poleward shift of the subtropical tropospheric jets in the maximum phase of the 11 year solar cycle, commonly explained in terms of a direct "top-down" propagation of solar signals from the stratosphere to the troposphere. We here demonstrate possible linkages to oceanic variability, instead. The observed response of the jets is qualitatively and quantitatively reproduced in an ensemble of simulations with a global model forced only at the lower boundary by the observed sea surface temperatures and sea ice concentrations, while keeping solar cycle forcing constant. The twentieth century reanalysis, in which only surface observations are assimilated, is characterized by a similar shift of the jets. These findings suggest that changes at the ocean surface could contribute considerably to the poleward shift of the subtropical tropospheric jets, although a top-down influence on the oceans and hence indirectly on the jets cannot be excluded.
A lagged response to the 11 year solar cycle in observed winter Atlantic/European weather patterns
Gray et al. 2014 Journal of Geophysical Research: Atmospheres
The surface response to 11 year solar cycle variations is investigated by analyzing the long-term mean sea level pressure and sea surface temperature observations for the period 1870-2010. The analysis reveals a statistically significant 11 year solar signal over Europe, and the North Atlantic provided that the data are lagged by a few years. The delayed signal resembles the positive phase of the North Atlantic Oscillation (NAO) following a solar maximum. The corresponding sea surface temperature response is consistent with this. A similar analysis is performed on long-term climate simulations from a coupled ocean-atmosphere version of the Hadley Centre model that has an extended upper lid so that influences of solar variability via the stratosphere are well resolved. The model reproduces the positive NAO signal over the Atlantic/European sector, but the lag of the surface response is not well reproduced. Possible mechanisms for the lagged nature of the observed response are discussed.
Reviewing the effect of CO2 and the sun on global climate
Florides et al. 2013 Renewable and Sustainable Energy Reviews
This paper discusses the effect of the greenhouse phenomenon and CO2 on global climate and suggests that numerical models that lack adequate knowledge of fundamental related factors cannot be used to extract "sound" conclusions. A very basic demonstration of this is done through a simple comparison between estimates of the forecast for global temperature increase obtained by various independent studies. Observing the global temperature and the CO2 atmospheric concentration though the geological aeons implies no obvious correlation. Physical observation on other planets like Mars and Venus, needing no numerical modeling, demonstrates the effect of the atmospheric-CO2 partial pressure on the temperature of the atmosphere. Moreover the CO2 role as a factor of danger or a benefactor for life is also addressed. On the other hand the role of the sun in the presently observed global warming has been greatly underestimated. Scientific evidence shows that the orbit of the earth and the Milankovitch cycles greatly affect the climate. A discussion follows pointing out the prime role that the sun should have on the earth's climate with regard to solar cycles' activity and irradiance, cosmic rays and cloud formation. The conclusion drawn here is that a natural signal of solar forcing has been mistakenly overlooked for an anthropogenic change, maybe owing to their quite similar effects on climate. For the moment science does not really have a complete and total understanding of the factors affecting the earth's complex climate system and therefore no sound conclusions can be drawn.
Influence of the Pacific Decadal Oscillation, El Nino-Southern Oscillation and solar forcing on climate and primary productivity changes in the northeast Pacific
Patterson et al. 2013 Quaternary International
Evidence of 11-year Schwabe solar sunspot cycles, El Nino-Southern Oscillation (ENSO) and the Pacific Decadal Oscillation (PDO) were detected in an annual record of diatomaceous laminated sediments from anoxic Effingham Inlet, Vancouver Island, British Columbia. Radiometric dating and counting of annual varves dates the sediments from AD 1947-1993. Intact sediment slabs were X-rayed for sediment structure (lamina thickness and composition based on gray-scale), and subsamples were examined for diatom abundances and for grain size. Wavelet analysis reveals the presence of c. 2-3, 4.5, 7 and 9-12 year cycles in the diatom record and an c. 11-13 year record in the sedimentary varve thickness record. These cycle lengths suggest that both ENSO and the sunspot cycle had an influence on primary productivity and sedimentation patterns. Sediment grain size could not be correlated to the sunspot cycle although a peak in the grain size data centered around the mid-1970s may be related to the 1976-1977 Pacific climate shift, which occurred when the PDO index shifted from negative (cool conditions) to positive (warm conditions). Additional evidence of the PDO regime shift is found in wavelet and cross-wavelet results for Skeletonema costatum, a weakly silicified variant of S. costatum, annual precipitation and April to June precipitation. Higher spring (April/May) values of the North Pacific High pressure index during sunspot minima suggest that during this time, increased cloud cover and concomitant suppression of the Aleutian Low (AL) pressure system led to strengthened coastal upwelling and enhanced diatom production earlier in the year. These results suggest that the 11-year solar cycle, amplified by cloud cover and upwelling changes, as well as ENSO, exert significant influence on marine primary productivity in the northeast Pacific. The expression of these cyclic phenomena in the sedimentary record were in turn modulated by the phase of PDO, as indicated by the change in period of ENSO and suppression of the solar signal in the record after the 1976-1977 regime shift.
Prediction of solar activity for the next 500 years
Steinhilber and Beer 2013 Journal of Geophysical Research
Recently, a new low-noise record of solar activity has been reconstructed for the past 10 149400 years by combining two Be records from Greenland and Antarctica with C from tree rings [Steinhilber et al., 2012]. This record confirms earlier results, namely, that the Sun has varied with distinct periodicities in the past. We present a prediction of mean solar magnetic activity averaged over 22 years for the next 500 years mainly based on the spectral information derived from the solar activity record of the past. Assuming that the Sun will continue to vary with the same periodicities for the next centuries, we extract the spectral information from the past and apply it to two different methods to predict the future of solar magnetic activity. First, the two methods are tested by predicting past changes. Our methods are able to predict periods of high and low solar activities for a few centuries in the past. However, they are less successful in predicting the correct amplitude. Then, the methods were used to predict the period 2000-2500. Both methods predict a period of low activity around 2100 A.D. Between 2100 and 2350 A.D., the results are inconsistent regarding the duration of the low-activity state in 2100 A.D. and the level of activity until 2250 A.D. Around 2250 A.D., both methods predict a period of moderate activity. After 2350 A.D., both methods point to a period of high activity. The period of high activity will end around 2400 A.D. and will be followed by a period of moderate activity.
Lengths of Schwabe cycles in the seventh and eighth centuries indicated by precise measurement of carbon-14 content in tree rings
Miyake et al. 2013 Journal of Geophysical Research
Radiocarbon (14C) is produced in the atmosphere by galactic cosmic rays, which are modulated by solar magnetic activity. Its content in tree rings is retained and provides a record of past cosmic ray intensity and solar activity. We have measured, with 2 year resolution, the 14C content in Japanese cedar tree rings for the period A.D. 600 to 760, which includes a small grand solar minimum in the seventh to eighth centuries. Periodicity analysis of the 14C data shows that there is a component in the frequency band of the Schwabe cycle, with a period of 12-13 years continuing throughout the minimum. This is the fourth case in which an increase in the length of the Schwabe cycle has been observed in a grand solar minimum, after the Maunder Minimum, the Spoerer Minimum, and the Fourth Century B.C. Minimum.
Global temperatures and sunspot numbers. Are they related?
Gil-Alana et al. 2013 Physica A
This paper deals with the analysis of global temperatures and sunspot numbers and the relationship between the two. We use techniques based on the concept of long range dependence. For the temperatures, the best specification seems to be a fractionally integrated or I(d) model with an order of integration d of about 0.46 and an estimated time trend coefficient that suggests that temperatures have increased by about 0.57 C over the last one hundred years. However, for the sunspot numbers, a cyclical fractional model seems to be more appropriate, with a periodicity of 11 years per cycle and an order of integration of about 0.40. Thus, the two series display long memory and fractional integration. However, the fact that both series display poles in the spectrum at different frequencies implies that we fail to reject the null hypothesis of no relationship between the two variables in the long run. Moreover, assuming that the sunspots are exogenous, the results show no statistical significance of this variable on the global temperatures, which is one of the main contributions of the present work.
Does the diurnal temperature range respond to changes in the cosmic ray flux?
Laken and Calogovic 2013 Environmental Research Letters 8, 045018
Recent studies have suggested that measurements of the diurnal temperature range (DTR) over Europe may provide evidence of a long-hypothesized link between the cosmic ray (CR) flux and cloud cover. Such propositions are interesting, as previous investigations of CR-cloud links are limited by data issues including long-term reliability and view-angle artifacts in satellite-based cloud measurements. Consequently, the DTR presents a further independent opportunity for assessment. Claims have been made that during infrequent high-magnitude increases (ground level enhancements, GLE) and decreases (Forbush decreases, Fd) in the CR flux significant anti-correlated DTR changes may be observed, and the magnitude of the DTR deviations increases with the size of the CR disturbance. If confirmed this may have important consequences for the estimation of natural climate forcing. We analyze these claims, and conclude that no statistically significant fluctuations in DTR (p < 0.05) are observed. Using detailed Monte Carlo significance testing we show that past claims to the contrary result from a methodological error in estimating significance connected to the effects of sub-sampling.
Terrestrial ground temperature variations in relation to solar magnetic variability, including the present Schwabe cycle
de Jager and Nieuwenhuijzen 2013 Natural Science 5, 1112-1120
We study the influence of solar activity on climate by investigating the relation between the long-term components of the total magnetic fluxes of both the equatorial and polar fields of the sun and the average terrestrial ground temperature. This is done for the period 1610 (beginning of systematic sunspot observations) till present with an extrapolation to 2015. It is found that from 1610 till about the first half of the 20th century the variation of the long-term average terrestrial ground temperatures is chiefly due to the variation of solar activity, with seemingly random, non-solar residuals. Around 2007, after the Grand Maximum of the 20th century, solar activity, after having gone through a remarkable transition period (c. 2005 to c. 2010), entered into another Grand Episode. That Episode started with the present solar cycle, in shape comparable to the equally weak Schwabe cycle #14. The transition period, in combination with the present low Schwabe cycle causes that the solar contribution to the total terrestrial temperature variation is small during the on-going decade. It results in a slowing down of the rise of temperature after c. 2005.
Holocene flood frequency across the Central Alps - solar forcing and evidence for variations in North Atlantic atmospheric circulation
Wirth et al. 2013 Quaternary Science Reviews 80, 112-128
The frequency of large-scale heavy precipitation events in the European Alps is expected to undergo substantial changes with current climate change. Hence, knowledge about the past natural variability of floods caused by heavy precipitation constitutes important input for climate projections. We present a comprehensive Holocene (10,000 years) reconstruction of the flood frequency in the Central European Alps combining 15 lacustrine sediment records. These records provide an extensive catalog of flood deposits, which were generated by flood-induced underflows delivering terrestrial material to the lake floors. The multi-archive approach allows suppressing local weather patterns, such as thunderstorms, from the obtained climate signal. We reconstructed mainly late spring to fall events since ice cover and precipitation in form of snow in winter at high-altitude study sites do inhibit the generation of flood layers. We found that flood frequency was higher during cool periods, coinciding with lows in solar activity. In addition, flood occurrence shows periodicities that are also observed in reconstructions of 14C and 10B solar activity from C and Be records (2500-3000, 900-1200, as well as of about 710, 500, 350, 208 (Suess cycle), 150, 104 and 87 (Gleissberg cycle) years). As atmospheric mechanism, we propose an expansion/shrinking of the Hadley cell with increasing/decreasing air temperature, causing dry/wet conditions in Central Europe during phases of high/low solar activity. Furthermore, differences between the flood patterns from the Northern Alps and the Southern Alps indicate changes in North Atlantic circulation. Enhanced flood occurrence in the South compared to the North suggests a pronounced southward position of the Westerlies and/or blocking over the northern North Atlantic, hence resembling a negative NAO state (most distinct from 4.2 to 2.4 kyr BP and during the Little Ice Age). South-Alpine flood activity therefore provides a qualitative record of variations in a paleo-NAO pattern during the Holocene. Additionally, increased South Alpine flood activity contrasts to low precipitation in tropical Central America (Cariaco Basin) on the Holocene and centennial time scale. This observation is consistent with a Holocene southward migration of the Atlantic circulation system, and hence of the ITCZ, driven by decreasing summer insolation in the Northern hemisphere, as well as with shorter-term fluctuations probably driven by solar activity.
Paleoclimate data-model comparison and the role of climate forcings over the past 1500 years
Phipps et al. 2013 Journal of Climate 26, 6915-6936
The past 1500 years provide a valuable opportunity to study the response of the climate system to external forcings. However, the integration of paleoclimate proxies with climate modeling is critical to improving the understanding of climate dynamics. In this paper, a climate system model and proxy records are therefore used to study the role of natural and anthropogenic forcings in driving the global climate. The inverse and forward approaches to paleoclimate data-model comparison are applied, and sources of uncertainty are identified and discussed. In the first of two case studies, the climate model simulations are compared with multiproxy temperature reconstructions. Robust solar and volcanic signals are detected in Southern Hemisphere temperatures, with a possible volcanic signal detected in the Northern Hemisphere. The anthropogenic signal dominates during the industrial period. It is also found that seasonal and geographical biases may cause multiproxy reconstructions to overestimate the magnitude of the long-term preindustrial cooling trend. In the second case study, the model simulations are compared with a coral d18O record from the central Pacific Ocean. It is found that greenhouse gases, solar irradiance, and volcanic eruptions all influence the mean state of the central Pacific, but there is no evidence that natural or anthropogenic forcings have any systematic impact on El Nino-Southern Oscillation. The proxy climate relationship is found to change over time, challenging the assumption of stationarity that underlies the interpretation of paleoclimate proxies. These case studies demonstrate the value of paleoclimate data-model comparison but also highlight the limitations of current techniques and demonstrate the need to develop alternative approaches.
Solar forcing of Caribbean drought events during the last millennium
Burn and Palmer 2013 Journal of Quaternary Science
Anthropogenic climate change is expected to increase the frequency of drought events in the earth's subtropical regions. However, the climate dynamics of these regions are not fully understood and debate surrounds how external forcing factors such as solar and volcanic forcing influence long-term rainfall patterns in the subtropics. Here, we present the first high-resolution reconstruction of Caribbean drought events over the last millennium based on analyses of sediment geochemical data from a continuous high-resolution coastal lake-sediment record in Jamaica. The record suggests extended episodes of drought occurred during the so-called Little Ice Age (1400-1850 CE), which were associated with El-Nino-like conditions in the eastern equatorial Pacific Ocean and controlled by low natural radiative forcing. Comparison of the Jamaican drought record with previously published palaeoclimatic archives from within the circum-Caribbean region suggests that dry conditions were associated with the southward migration of the Hadley Cell, a stronger North Atlantic High and the concomitant intensification of the north-east trade winds and the Caribbean Low Level Jet. We conclude that pre-industrial climatic change in the region was probably controlled by solar forcing and modulated by the combined influence of El Nino Southern Oscillation and the North Atlantic Oscillation.
North-south palaeohydrological contrasts in the central Mediterranean during the Holocene: tentative synthesis and working hypotheses
Magny et al. 2013 Climate of the Past 9, 2043-2071
On the basis of a multi-proxy approach and a strategy combining lacustrine and marine records along a north-south transect, data collected in the central Mediterranean within the framework of a collaborative project have led to reconstruction of high-resolution and well-dated palaeohydrological records and to assessment of their spatial and temporal coherency. Contrasting patterns of palaeohydrological changes have been evidenced in the central Mediterranean: south (north) of around 40N of latitude, the middle part of the Holocene was characterised by lake-level maxima (minima), during an interval dated to ca. 10 300-4500 cal BP to the south and 9000-4500 cal BP to the north. Available data suggest that these contrasting palaeohydrological patterns operated throughout the Holocene, both on millennial and centennial scales. Regarding precipitation seasonality, maximum humidity in the central Mediterranean during the middle part of the Holocene was characterised by humid winters and dry summers north of ca. 40N, and humid winters and summers south of ca. 40N. This may explain an apparent conflict between palaeoclimatic records depending on the proxies used for reconstruction as well as the synchronous expansion of tree species taxa with contrasting climatic requirements. In addition, south of ca. 40N, the first millennium of the Holocene was characterised by very dry climatic conditions not only in the eastern, but also in the central- and the western Mediterranean zones as reflected by low lake levels and delayed reforestation. These results suggest that, in addition to the influence of the Nile discharge reinforced by the African monsoon, the deposition of Sapropel 1 has been favoured (1) by an increase in winter precipitation in the northern Mediterranean borderlands, and (2) by an increase in winter and summer precipitation in the southern Mediterranean area. The climate reversal following the Holocene climate optimum appears to have been punctuated by two major climate changes around 7500 and 4500 cal BP. In the central Mediterranean, the Holocene palaeohydrological changes developed in response to a combination of orbital, ice-sheet and solar forcing factors. The maximum humidity interval in the south-central Mediterranean started ca. 10 300 cal BP, in correlation with the decline (1) of the possible blocking effects of the North Atlantic anticyclone linked to maximum insolation, and/or (2) of the influence of the remnant ice sheets and fresh water forcing in the North Atlantic Ocean. In the north-central Mediterranean, the lake-level minimum interval began only around 9000 cal BP when the Fennoscandian ice sheet disappeared and a prevailing positive NAO-(North Atlantic Oscillation) type circulation developed in the North Atlantic area. The major palaeohydrological oscillation around 4500-4000 cal BP may be a non-linear response to the gradual decrease in insolation, with additional key seasonal and interhemispheric changes. On a centennial scale, the successive climatic events which punctuated the entire Holocene in the central Mediterranean coincided with cooling events associated with deglacial outbursts in the North Atlantic area and decreases in solar activity during the interval 11 700-7000 cal BP, and to a possible combination of NAO-type circulation and solar forcing since ca. 7000 cal BP onwards. Thus, regarding the centennial-scale climatic oscillations, the Mediterranean Basin appears to have been strongly linked to the North Atlantic area and affected by solar activity over the entire Holocene. In addition to model experiments, a better understanding of forcing factors and past atmospheric circulation patterns behind the Holocene palaeohydrological changes in the Mediterranean area will require further investigation to establish additional high-resolution and well-dated records in selected locations around the Mediterranean Basin and in adjacent regions. Special attention should be paid to greater precision in the reconstruction, on millennial and centennial timescales, of changes in the latitudinal location of the limit between the northern and southern palaeohydrological Mediterranean sectors, depending on (1) the intensity and/or characteristics of climatic periods/oscillations (e.g. Holocene thermal maximum versus Neoglacial, as well as, for instance, the 8.2 ka event versus the 4 ka event or the Little Ice Age); and (2) on varying geographical conditions from the western to the eastern Mediterranean areas (longitudinal gradients). Finally, on the basis of projects using strategically located study sites, there is a need to explore possible influences of other general atmospheric circulation patterns than NAO, such as the East Atlantic-West Russian or North Sea-Caspian patterns, in explaining the apparent complexity of palaeoclimatic (palaeohydrological) Holocene records from the Mediterranean area.
A reconstruction of radiocarbon production and total solar irradiance from the Holocene 14C and CO2 records: implications of data and model uncertainties
Roth and Joos 2013 Climate of the Past 9, 1879-1909
Radiocarbon production, solar activity, total solar irradiance (TSI) and solar-induced climate change are reconstructed for the Holocene (10 to 0 kyr BP), and TSI is predicted for the next centuries. The IntCal09/SHCal04 radiocarbon and ice core CO2 records, reconstructions of the geomagnetic dipole, and instrumental data of solar activity are applied in the Bern3D-LPJ, a fully featured Earth system model of intermediate complexity including a 3-D dynamic ocean, ocean sediments, and a dynamic vegetation model, and in formulations linking radiocarbon production, the solar modulation potential, and TSI. Uncertainties are assessed using Monte Carlo simulations and bounding scenarios. Transient climate simulations span the past 21 thousand years, thereby considering the time lags and uncertainties associated with the last glacial termination. Our carbon-cycle-based modern estimate of radiocarbon production of 1.7 atoms cm-2 s-1 is lower than previously reported for the cosmogenic nuclide production model by Masarik and Beer (2009) and is more in line with Kovaltsov et al. (2012). In contrast to earlier studies, periods of high solar activity were quite common not only in recent millennia, but throughout the Holocene. Notable deviations compared to earlier reconstructions are also found on decadal to centennial timescales. We show that earlier Holocene reconstructions, not accounting for the interhemispheric gradients in radiocarbon, are biased low. Solar activity is during 28% of the time higher than the modern average (650 MeV), but the absolute values remain weakly constrained due to uncertainties in the normalisation of the solar modulation to instrumental data. A recently published solar activity-TSI relationship yields small changes in Holocene TSI of the order of 1 W m-2 with a Maunder Minimum irradiance reduction of 0.85 +- 0.16 W m-2. Related solar-induced variations in global mean surface air temperature are simulated to be within 0.1 K. Autoregressive modelling suggests a declining trend of solar activity in the 21st century towards average Holocene conditions.
Reconstruction and Prediction of Variations in the Open Solar Magnetic Flux and Interplanetary Conditions
Lockwood 2013 Living Reviews Solar Physics 10, 4
Historic geomagnetic activity observations have been used to reveal centennial variations in the open solar flux and the near-Earth heliospheric conditions (the interplanetary magnetic field and the solar wind speed). The various methods are in very good agreement for the past 135 years when there were sufficient reliable magnetic observatories in operation to eliminate problems due to site-specific errors and calibration drifts. This review underlines the physical principles that allow these reconstructions to be made, as well as the details of the various algorithms employed and the results obtained. Discussion is included of: the importance of the averaging timescale; the key differences between "range" and "interdiurnal variability" geomagnetic data; the need to distinguish source field sector structure from heliospherically-imposed field structure; the importance of ensuring that regressions used are statistically robust; and uncertainty analysis. The reconstructions are exceedingly useful as they provide calibration between the in-situ spacecraft measurements from the past five decades and the millennial records of heliospheric behaviour deduced from measured abundances of cosmogenic radionuclides found in terrestrial reservoirs. Continuity of open solar flux, using sunspot number to quantify the emergence rate, is the basis of a number of models that have been very successful in reproducing the variation derived from geomagnetic activity. These models allow us to extend the reconstructions back to before the development of the magnetometer and to cover the Maunder minimum. Allied to the radionuclide data, the models are revealing much about how the Sun and heliosphere behaved outside of grand solar maxima and are providing a means of predicting how solar activity is likely to evolve now that the recent grand maximum (that had prevailed throughout the space age) has come to an end.
Discussion on climate oscillations: CMIP5 general circulation models versus a semi-empirical harmonic model based on astronomical cycles
Scafetta 2013 Earth Science Reviews
Power spectra of global surface temperature (GST) records (available since 1850) reveal periodities at about 9.1, 10-11, 19-22 and 59-62 years. Equivalent oscillations are found in numerous multisecular paleoclimatic records. The CMIP5 general circulation models (GCMs), to be used in the 2013 IPCC AR5 report, are analyzed and found not able to reconstruct this variability. In particular, from 2000 to 2013.5 a GST plateau is observed, while the GCMs predicted a warming of about 2 C/century. In contrast, the hypothesis that the climate is regulated by specific natural oscillations better interprets the GST records at multiple time scales. For example, a quasi 60-year natural oscillation explains the 1850-1880, 1910-1940 and 1970-2000 warming periods, the 1880-1910 and 1940-1970 cooling periods and the post 2000 plateau. This hypothesis implies that about 50% of the c. 0.5 C global surface warming observed from 1970 to 2000 was due to natural oscillations of the climate system, not to anthropogenic forcing as modeled by the GCMs. The climate sensitivity to CO2 doubling should be reduced from the claimed 2.0-4.5 C range to 1.0-2.3 C with a likely median of c. 1.5 C instead of c. 3.0 C. Also modern paleoclimatic temperature reconstructions showing a larger preindustrial variability than the hockey-stick shaped temperature reconstructions developed in early 2000 imply a lower anthropogenic effect and a larger solar effect. The observed natural oscillations could be driven by astronomical forcings. The c. 9.1 year oscillation appears to be a combination of long soli-lunar tidal oscillations, while quasi 10-11, 20 and 60 year oscillations are typically found among major solar and heliospheric oscillations driven mostly by Jupiter and Saturn movements. Solar models based on heliospheric oscillations also predict quasi secular (e.g. c. 115 year) and millennial (e.g. c. 983 year) solar oscillations, which hindcast observed climate oscillations during the Holocene. It is proposed a semi-empirical climate model made of six specific astronomical oscillations as constructors of the natural climate variability spanning from the decadal to the millennial scales plus a 50% attenuated radiative warming component deduced from the GCM mean simulation as a measure of the anthropogenic plus volcano effect. The semi-empirical model reconstructs the 1850-2012 climatic patterns significantly better than any CMIP5 GCM simulation. Under the same CMIP5 anthropogenic emission scenarios, the model projects a possible 2000-2100 average warming ranging from about 0.3 C to 1.8 C. This range is significantly below the original CMIP5 GCM ensemble mean projections spanning from about 1 C to 4 C. Future research should better investigate space-climate coupling mechanisms and develop more advanced semi-empirical climate models. HadCRUT3 and HadCRUT4, UAH MSU, RSS MSU, GISS and NCDC temperature reconstructions are analyzed.
On the insignificance of Herschel's sunspot correlation
Love, 2013 Geophysical Research Letters
We examine William Herschel's hypothesis that solar-cycle variation of the Sun's irradiance has a modulating effect on the Earth's climate, and that this is, specifically, manifest as an anticorrelation between sunspot number and the market price of wheat. Since Herschel first proposed his hypothesis in 1801, it has been regarded with both interest and skepticism. Recently, reports have been published that either support Herschel's hypothesis or rely on its validity. As a test of Herschel's hypothesis, we seek to reject a null hypothesis of a statistically random correlation between historical sunspot numbers, wheat prices in London and the United States, and wheat-farm yields in the United States. We employ binary-correlation, Pearson-correlation, and frequency-domain methods. We test our methods using an historical geomagnetic-activity index, well known to be causally correlated with sunspot number. As expected, the measured correlation between sunspot number and geomagnetic activitywould be an unlikely realization of random data; the correlation is "statistically significant". On the other hand, measured correlations between sunspot number and wheat-price and wheat-yield data would be very likely realizations of random data; these correlations are "insignificant". Therefore, Herschel's hypothesis must be regarded with skepticism. We compare and contrast our results with those of other researchers. We discuss procedures for evaluating hypotheses that are formulated from historical data.
The role of the Sun in atmosphere-ocean coupling
Roy 2013 International Journal of Climatology
An overview of the processes involved in determining the Sun''s influence on climate is presented in the form of a flow chart. Evidence and hypotheses concerning the combined influences of the El Niño-Southern Oscillation, the Quasi-Biennial Oscillation and the Solar Cycle on the Hadley and Walker circulations are discussed in the context of atmosphere-ocean coupling, focussing on the Pacific region. It is shown that the Sun plays a crucial role in ocean-atmosphere coupling but that this coupling appears to be disturbed during the latter half of the 20th century, probably related to climate change. The identification of a solar influence can lead to improved skill in prediction so as to better inform communities to address/mitigate some of the crucial issues that are associated with climate change.
Solar and planetary oscillation control on climate change: hind-cast, forecast and a comparison with the CMIP5 GCMs
Scafetta 2013 Energy and Environment 24, 455-496
Global surface temperature records (e.g. HadCRUT4) since 1850 are characterized by climatic oscillations synchronous with specific solar, planetary and lunar harmonics superimposed on a background warming modulation. The latter is related to a long millennial solar oscillation and to changes in the chemical composition of the atmosphere (e.g. aerosol and greenhouse gases). However, current general circulation climate models, e.g. the CMIP5 GCMs, to be used in the AR5 IPCC Report in 2013, fail to reconstruct the observed climatic oscillations. As an alternate, an empirical model is proposed that uses: (1) a specific set of decadal, multidecadal, secular and millennial astronomic harmonics to simulate the observed climatic oscillations; (2) a 0.45 attenuation of the GCM ensemble mean simulations to model the anthropogenic and volcano forcing effects. The proposed empirical model outperforms the GCMs by better hind-casting the observed 1850-2012 climatic patterns. It is found that: (1) about 50-60% of the warming observed since 1850 and since 1970 was induced by natural oscillations likely resulting from harmonic astronomical forcings that are not yet included in the GCMs; (2) a 2000-2040 approximately steady projected temperature; (3) a 2000-2100 projected warming ranging between 0.3 C and 1.6 C, which is significantly lower than the IPCC GCM ensemble mean projected warming of 1.1 oC to 4.1 oC ; (4) an equilibrium climate sensitivity to CO2 doubling centered in 1.35 oC and varying between 0.9 oC and 2.0 oC.
IPCC underestimates the sun's role in climate change
van Geel and Ziegler 2013 Energy and Environment 24, 431-453
For the understanding of current and future climate change it is a basic pre requisite to properly understand the mechanisms, which controlled climate change after the Last Ice Age. According to the IPCC 5th assessment report (in prep.) the Sun has not been a major driver of climate change during the post-Little Ice Age slow warming, and particularly not during the last 40 years. This statement requires critical review as the IPCC neglects strong paleo-climatologic evidence for the high sensitivity of the climate system to changes in solar activity. This high climate sensitivity is not alone due to variations in total solar irradiance-related direct solar forcing, but also due to additional, so-called indirect solar forcings. These include solar-related chemical-based UV irradiance-related variations in stratospheric temperatures and galactic cosmic ray-related changes in cloud cover and surface temperatures, as well as ocean oscillations, such as the Pacific Decadal Oscillation and the North Atlantic Oscillation that significant affect the climate. As it is still difficult to quantify the relative contribution of combined direct and indirect solar forcing and of increased atmospheric CO2 concentrations to the slow warming of the last 40 years, predictions about future global warming based exclusively on anthropogenic CO2 emission scenarios are premature. Nevertheless, the cyclical temperature increase of the 20th century coincided with the buildup and culmination of the Grand Solar Maximum that commenced in 1924 and ended in 2008. The anticipated phase of declining solar activity of the coming decades will be a welcome "natural laboratory" to clarify and quantify the present and future role of solar variation in climate change.
Impact of a potential 21st century "grand solar minimum" on surface temperatures and stratospheric ozone
Anet et al. 2013 Geophysical Research Letters
We investigate the effects of a recently proposed 21st century Dalton-minimum-like decline of solar activity on the evolution of Earths' climate and ozone layer. Three sets of 2-member ensemble simulations, radiatively forced by a mid-level emission scenario (IPCC RCP4.5), are performed with the atmosphere-ocean chemistry climate model AOCCM SOCOL3-MPIOM, one with constant solar activity, the other two with reduced solar activity and different strength of the solar irradiance forcing. A future grand solar minimum will reduce the global mean surface warming of 2K between 1986-2005 and 2081-2100 by 0.2 to 0.3 K. Furthermore, the decrease in solar UV radiation leads to a significant delay of stratospheric ozone recovery by 10 years and longer. Therefore, the effects of a solar activity minimum, should it occur, may interfere with international efforts for the protection of global climate and the ozone layer.
A Holocene paleoclimate reconstruction for eastern Canada based on d18O cellulose of Sphagnum mosses from Mer Bleue Bog
El Bilali et al. 2013 The Holocene
We present a c. 9200 yr high-resolution oxygen isotope record of plant cellulose (d18Ocel) from the peat deposits of Mer Bleue Bog, Ontario and apply it as a proxy for paleotemperature reconstruction in Eastern Canada. The results show that d18Ocel of Sphagnum follows the general pattern of the Northern Hemisphere reconstructed paleotemperature record for the last 2000 years at a ratio of c. 0.2%d18Ocel/°C. The d18Ocel record of ombrotrophic phase of Mer Bleue Bog is also in accordance with major features of the Holocene sunspot number reconstruction. Three distinct time intervals have low d18Ocel values: 200-800 cal. BP ("Little Ice Age"); 2800-3400 cal. BP synchronous to a cooling period reported elsewhere in North America; and 4200-4600 cal. BP corresponding to a cooling interval in the North Atlantic region. These cooling periods also correlate well with negative excursions in the Holocene sunspot and cosmogenic 10Be records. A fourth period of low d18Ocel values between AD 1810 and 1820 may be related to the extremely cold summer of 1816 and cooler subsequent years, which occurred in the aftermath of the Tambora volcanic eruption, or possibly cooling associated with the early 19th century Dalton solar minimum. The results also indicate the presence of millennial-scale cycles possibly comparable with the globally recognized Bond cycles that have been correlated to fluctuations in solar irradiance.
A modern Maunder Minimum would not stave off global warming
Schultz 2013 EOS 94, 276
Roughly every 11 years, the Sun's activity swings, a peak-to-peak oscillation in the presence of sunspots on the solar surface. From around 1645 to 1715, however, researchers think that this largely reliable trend in solar activity stalled. Now known as the Maunder Minimum, the period saw not just a prolonged dearth of sunspot activity but also a likely reduction in the output of energy from the Sun. Researchers estimate that the Maunder Minimum could have caused a reduction in solar irradiance of around 0.01% to 0.25%, a shift that contributed to a drop of globally averaged surface air temperature of a few tenths of a degree.
Climate change and decadal to centennial-scale climate periodicities recorded in a late Holocene NE Pacific marine record: Examining the role of solar forcing
Galloway et al. 2013 Palaeogeography, Palaeoclimatology, Palaeoecology
We present a decadal-scale late Holocene climate record based on diatoms, biogenic silica, and grain size from a 12-m sediment core (VEC02A04) obtained from Frederick Sound in the Seymour-Belize Inlet Complex of British Columbia, Canada. Sediments are characterized by graded, massive, and laminated intervals. Laminated intervals are most common between c. 2948-2708 cal. yr BP and c. 1992-1727 cal. yr BP. Increased preservation of laminated sediments and diatom assemblage changes at this time suggest that climate became moderately drier and cooler relative to the preceding and succeeding intervals. Spectral and wavelet analyses are used to test for statistically significant periodicities in time series of proxies of primary production (total diatom abundance, biogenic silica) and hydrology (grain size) preserved in the Frederick Sound record. Periodicities of c. 42-53, 60-70, 82-89, 241-243, and 380 yrs are present. Results are compared to reconstructed sunspot number data of Solanki et al. (2004) using cross wavelet transform to evaluate the role of solar forcing on NE Pacific climate. Significant common power of periodicities between c. 42-60, 70-89, 204-243, and of 380 yrs occur, suggesting that celestial forcing impacted late Holocene climate at Frederick Sound. Replication of the c. 204-243 yr periodicity in sunspot time series is most pronounced between c. 2900 cal. yr BP and c. 2000 cal. yr BP, broadly correlative to the timing of maximum preservation of laminated sedimentary successions and diatom assemblage changes. High solar activity at the Suess/de Vries band may have been manifested as a prolonged westward shift and/or weakening of the Aleutian Low in the mid-late Holocene, which would have diverted fewer North Pacific storms and resulted in the relatively dry conditions reconstructed for the Seymour-Belize Inlet Complex.
The Effects of Solar Variability on Earth's Climate: A Workshop Report (September 8-9, 2011)
NAS 2012 The National Academies Press, Washington, 71 pp.
On September 8-9, 2011, experts in solar physics, climate models, paleoclimatology, and atmospheric science assembled at the National Center for Atmospheric Research (NCAR) in Boulder, Colorado for a workshop to consider the Sun's variability over time and potential Sun-climate connections. While it does not provide findings, recommendations, or consensus on the current state of the science, The Effects of Solar Variability on Earth's Climate: A Workshop Report briefly introduces the primary topics discussed by presenters at the event. As context for these topics, the summary includes background information on the potential Sun-climate connection, the measurement record from space, and potential perturbations of climate due to long-term solar variability. This workshop report also summarizes some of the science questions explored by the participants as potential future research endeavors.
Reconciliation of modeled climate responses to spectral solar forcing
Wen et al. 2013 Journal of Geophysical Research
The SIM (Spectral Irradiance Monitor) on SORCE (Solar Radiation and Climate Experiment) provides more spectrally complete daily SSI (spectral solar irradiance) measurements than ever before, allowing us to explore chemical and physical processes in the Earth's ocean and atmosphere system. However, the newly observed SSI instigated controversies in the Sun-climate community on whether the SIM-observed trends are true solar variations and on whether climate responses are in phase or out of phase with solar forcing. In this study, we focus on resolving two apparently contradictory results published on possible temperature responses to SIM-derived solar forcing. When applying extreme scenarios of SIM-based spectral solar forcing in a radiative-convective model (RCM), we find that some apparently contradictory results can be explained by the different methods used to apply the SIM SSI data. It is clear that accurate SSI data are essential for accurate climate simulations and that climate modelers need to take care how they apply these data.
Atmospheric annular modes in simulation over the past millennium: No long-term response to external forcing
Gómez-Navarro and Zorita 2013 Geophysical Research Letters 40, 1-5
This study analyzes whether the imprint of external forcings can be detected in the long-term evolution of the main atmospheric circulation patterns in climate simulations over the last millennium. The external forcing is not found to significantly add variability in any frequency band compared to control simulations where the external drivers are kept constant. Additionally, a method designed to detect a common signal in the time evolution of these circulation patterns among all simulations is proposed, and employed to demonstrate that the null hypothesis of an evolution dominated by internal variability cannot be rejected regardless of the time smoothing applied to the series. Given that the fingerprint of external forcings on atmospheric circulation has been successfully detected in simulations of the 20th century climate and in future climate change projections, we argue that either the effect of past natural forcing is too small, state-of-the-art climate models underestimate their climate sensitivity, or the anthropogenic forcing qualitatively differs from the natural forcing in its effect on main circulation patterns.
Cosmic-ray-driven reaction and greenhouse effect of halogenated molecules: culprits for atmospheric ozone depletion and global climate change
Lu, 2012. International Journal of Modern Physics B 27, 1350073
This study is focused on the effects of cosmic rays (solar activity) and halogen-containing molecules (mainly chlorofluorocarbons - CFCs) on atmospheric ozone depletion and global climate change. Brief reviews are first given on the cosmic-ray-driven electron-induced-reaction (CRE) theory for O3 depletion and the warming theory of halogenated molecules for climate change. Then natural and anthropogenic contributions to these phenomena are examined in detail and separated well through in-depth statistical analyses of comprehensive measured datasets of quantities, including cosmic rays (CRs), total solar irradiance, sunspot number, halogenated gases (CFCs, CCl4 and HCFCs), CO2, total O3, lower stratospheric temperatures and global surface temperatures. For O3 depletion, it is shown that an analytical equation derived from the CRE theory reproduces well 11-year cyclic variations of both polar O3 loss and stratospheric cooling, and new statistical analyses of the CRE equation with observed data of total O3 and stratospheric temperature give high linear correlation coefficients >= 0.92. After the removal of the CR effect, a pronounced recovery by 20~25% of the Antarctic O3 hole is found, while no recovery of O3 loss in mid-latitudes has been observed. These results show both the correctness and dominance of the CRE mechanism and the success of the Montreal Protocol. For global climate change, in-depth analyses of the observed data clearly show that the solar effect and human-made halogenated gases played the dominant role in Earth's climate change prior to and after 1970, respectively. Remarkably, a statistical analysis gives a nearly zero correlation coefficient (R = -0.05) between corrected global surface temperature data by removing the solar effect and CO2 concentration during 1850-1970. In striking contrast, a nearly perfect linear correlation with coefficients as high as 0.96-0.97 is found between corrected or uncorrected global surface temperature and total amount of stratospheric halogenated gases during 1970-2012. Furthermore, a new theoretical calculation on the greenhouse effect of halogenated gases shows that they (mainly CFCs) could alone result in the global surface temperature rise of ~0.6°C in 1970-2002. These results provide solid evidence that recent global warming was indeed caused by the greenhouse effect of anthropogenic halogenated gases. Thus, a slow reversal of global temperature to the 1950 value is predicted for coming 5~7 decades. It is also expected that the global sea level will continue to rise in coming 1~2 decades until the effect of the global temperature recovery dominates over that of the polar O3 hole recovery; after that, both will drop concurrently. All the observed, analytical and theoretical results presented lead to a convincing conclusion that both the CRE mechanism and the CFC-warming mechanism not only provide new fundamental understandings of the O3 hole and global climate change but have superior predictive capabilities, compared with the conventional models.
Multidecadal to multicentury scale collapses of Northern Hemisphere monsoons over the past millennium
Asmerom et al. 2013 PNAS
Late Holocene climate in western North America was punctuated by periods of extended aridity called megadroughts. These droughts have been linked to cool eastern tropical Pacific sea surface temperatures (SSTs). Here, we show both short-term and long-term climate variability over the last 1,500 y from annual band thickness and stable isotope speleothem data. Several megadroughts are evident, including a multicentury one, AD 1350-1650, herein referred to as Super Drought, which corresponds to the coldest period of the Little Ice Age. Synchronicity between southwestern North American, Chinese, and West African monsoon precipitation suggests the megadroughts were hemispheric in scale. Northern Hemisphere monsoon strength over the last millennium is positively correlated with Northern Hemisphere temperature and North Atlantic SST. The megadroughts are associated with cooler than average SST and Northern Hemisphere temperatures. Furthermore, the megadroughts, including the Super Drought, coincide with solar insolation minima, suggesting that solar forcing of sea surface and atmospheric temperatures may generate variations in the strength of Northern Hemisphere monsoons. Our findings seem to suggest stronger (wetter) Northern Hemisphere monsoons with increased warming.
Solar influence on climate variability and human development during the Neolithic: evidence from a high-resolution multi-proxy record from Templevanny Lough, County Sligo, Ireland
Stolze et al. 2013 Quaternary Science Reviews 67, 138-159
The relationship between climatic variations, vegetation dynamics and early human activity between c. 4150-2860 BC was reconstructed from a high-resolution pollen and geochemical record obtained from a small lake located in County Sligo, Ireland. The proxy record suggests the existence of a woodland with a largely closed canopy at the start of the fourth millennium BC. Only minor human disturbance is recorded. Following an episode of increased rainfall at c. 3990 BC, a decrease in the elm population occurred between c. 3970 and 3820 BC. This coincided with a period of warming and drying climatic conditions and an initial increase in anthropogenic activities. A second episode of high precipitation between c. 3830-3800 BC was followed by a steep increase in human impact on the landscape, which became most pronounced between c. 3740 and 3630 BC. At this time, the lake level of Templevanny Lough was at its lowest during the Neolithic. The onset of wetter and cooler conditions after c. 3670 BC, representing the transition from the Early to the Middle Neolithic, coincided with a period of woodland recovery. The Middle Neolithic was characterised by pronounced climatic oscillations including periods of substantial rainfall between c. 3600 and 3500 BC and between c. 3500 and 3460 BC. A nearly century-long climatic amelioration between c. 3460-3370 BC facilitated a revival of human activity on a small scale around the lake. Abandonment of the area and full woodland recovery occurred after a period of particularly wet and cool conditions ranging from c. 3360-3290 BC. The pollen and geochemistry data suggest that the Late Neolithic was marked by a period of ameliorated conditions between c. 3110-3050 BC that was followed by two episodes of high rainfall at c. 3060-3030 BC and c. 2940-2900 BC. The timing of the climatic shifts inferred from the Templevanny Lough record is in agreement with those of moisture/precipitation and temperature reconstructions from northern and western Europe and the Alps, suggesting that the studied period was characterised by a high-frequency climate variability. The results of the present study imply that human development during the Irish Neolithic was influenced by climatic variations. These climatic shifts correspond to variations in solar activity, suggesting a solar forcing on climate.
Claim of solar influence is on thin ice: are 11-year cycle solar minima associated with severe winters in Europe?
van Oldenborgh et al. 2013 Environmental Research Letters 8, 024014
A recent paper in Geophysical Research Letters, 'Solar influence on winter severity in central Europe', by Sirocko et al (2012 Geophys. Res. Lett. 39 L16704) claims that 'weak solar activity is empirically related to extremely cold winter conditions in Europe' based on analyses of documentary evidence of freezing of the River Rhine in Germany and of the Reanalysis of the Twentieth Century (20C). However, our attempt to reproduce these findings failed. The documentary data appear to be selected subjectively and agree neither with instrumental observations nor with two other reconstructions based on documentary data. None of these datasets show significant connection between solar activity and winter severity in Europe beyond a common trend. The analysis of Sirocko et al of the 20C circulation and temperature is inconsistent with their time series analysis. A physically-motivated consistent methodology again fails to support the reported conclusions. We conclude that multiple lines of evidence contradict the findings of Sirocko et al.
The importance of time-varying forcing for QBO modulation of the atmospheric 11-year solar cycle signal
Matthes et al. 2013 Journal Of Geophysical Research Atmospheres
We present results from three multi-decadal sensitivity experiments with time-varying solar cycle and Quasi-Biennial Oscillation (QBO) forcings using NCAR's Whole Atmosphere Community Climate Model (WACCM3.1). The model experiments are unique compared to earlier studies as they use time-varying forcings either for the solar cycle only and the QBO, both individually and combined. The results show that the annual mean solar response in the tropical upper stratosphere is independent of the presence of the QBO. The response in the middle to lower stratosphere differs depending on the presence of the QBO and the solar cycle but is statistically indistinguishable in the three experiments. The seasonal evolution of the solar and the combined solar-QBO signals reveals a reasonable agreement with observations only for the experiment in which both the solar cycle and the QBO forcing are present, suggesting that both forcings are important to generate the observed response. More stratospheric warmings occur during solar maximum and QBO west conditions. This appears to be the result of a QBO modulation of the background zonalmean wind climatology, which modifies the solar signal. Depending on the background wind the small initial early winter solar signal in the subtropical upper stratosphere/lower mesosphere is enhanced during QBO east and diminished during QBO west conditions. This consequently influences the transfer of the solar-QBO signal during winter and results in the observed differences during late winter.
Could a future "Grand Solar Minimum" like the Maunder Minimum stop global warming?
Meehl et al. 2013 Geophysical Research Letters
A future Maunder Minimum type grand solar minimum, with total solar irradiance reduced by 0.25% over a 50 year period from 2020 to 2070, is imposed in a future climate change scenario experiment (RCP4.5) using, for the first time, a global coupled climate model that includes ozone chemistry and resolved stratospheric dynamics (Whole Atmosphere Community Climate Model). This model has been shown to simulate two amplifying mechanisms that produce regional signals of decadal climate variability comparable to observations, and thus is considered a credible tool to simulate the Sun's effects on Earth's climate. After the initial decrease of solar radiation in 2020, globally averaged surface air temperature cools relative to the reference simulation by up to several tenths of a degree Centigrade. By the end of the grand solar minimum in 2070, the warming nearly catches up to the reference simulation. Thus, a future grand solar minimum could slow down but not stop global warming.
Solar influenced late Holocene temperature changes on the northern Tibetan Plateau
YuXin et al. 2013 Chinese Science Bulletin 58, 1053-1059
Considerable efforts have been made to extend temperature records beyond the instrumental period through proxy reconstructions, in order to further understand the mechanisms of past climate variability. Yet, the global coverage of existing temperature records is still limited, especially for some key regions like the Tibetan Plateau and for earlier times including the Medieval Warm Period (MWP). Here we present decadally-resolved, alkenone-based, temperature records from two lakes on the northern Tibetan Plateau. Characterized by marked temperature variability, our records provide evidence that temperatures during the MWP were slightly higher than the modern period in this region. Further, our temperature reconstructions, within age uncertainty, can be well correlated with solar irradiance changes, suggesting a possible link between solar forcing and natural climate variability, at least on the northern Tibetan Plateau.
The AD775 cosmic event revisited: the Sun is to blame
Usoskin et al. 2013 Astronomy & Astrophysics 552, L3
Aims. Miyake et al. (2012, Nature, 486, 240, henceforth M12) recently reported, based on 14C data, an extreme cosmic event in about AD775. Using a simple model, M12 claimed that the event was too strong to be caused by a solar flare within the standard theory. This implied a new paradigm of either an impossibly strong solar flare or a very strong cosmic ray event of unknown origin that occurred around AD775. However, as we show, the strength of the event was significantly overestimated by M12. Several subsequent works have attempted to find a possible exotic source for such an event, including a giant cometary impact upon the Sun or a gamma-ray burst, but they are all based on incorrect estimates by M12. We revisit this event with analysis of new datasets and consistent theoretical modelling. Methods. We verified the experimental result for the AD775 cosmic ray event using independent datasets including 10Be series and newly measured 14C annual data. We surveyed available historical chronicles for astronomical observations for the period around the AD770s to identify potential sightings of aurorae borealis and supernovae. We interpreted the 14C measurements using an appropriate carbon cycle model. Results. We show that: (1) The reality of the AD775 event is confirmed by new measurements of 14C in German oak; (2) by using an inappropriate carbon cycle model, M12 strongly overestimated the event''s strength; (3) the revised magnitude of the event (the global 14C production Q = (1.1 - 1.5) x 108 atoms/cm2) is consistent with different independent datasets (14C, 10Be, 36Cl) and can be associated with a strong, but not inexplicably strong, solar energetic particle event (or a sequence of events), and provides the first definite evidence for an event of this magnitude (the fluence >30 MeV was about 4.5 x 1010 cm-2) in multiple datasets; (4) this interpretation is in agreement with increased auroral activity identified in historical chronicles. Conclusions. The results point to the likely solar origin of the event, which is now identified as the greatest solar event on a multi-millennial time scale, placing a strong observational constraint on the theory of explosive energy releases on the Sun and cool stars.
Terrestrial effects of possible astrophysical sources of an AD 774-775 increase in 14C production
Thomas et al. 2013 Geophysical Research Letters
We examine possible sources of a substantial increase in tree ring 14C measurements for the years AD 774-775. Contrary to claims regarding a coronal mass ejection (CME), the required CME energy is not several orders of magnitude greater than known solar events. We consider solar proton events (SPEs) with three different fluences and two different spectra. The data may be explained by an event with fluence about one order of magnitude beyond the October 1989 SPE. Two hard spectrum cases considered here result in moderate ozone depletion, so no mass extinction is implied, though we do predict increases in erythema and damage to plants from enhanced solar UV. We are able to rule out an event with a very soft spectrum that causes severe ozone depletion and subsequent biological impacts. Nitrate enhancements are consistent with their apparent absence in ice core data. The modern technological implications of such an event may be extreme, and considering recent confirmation of superflares on solar-type stars, this issue merits attention.
Modeled rapid adjustments in diurnal temperature range response to CO2 and solar forcings
Jackson and Foster 2013 Journal Of Geophysical Research: Atmospheres
We used the National Center for Atmospheric Research single column climate model to determine if rapid adjustments to surface heat fluxes contribute to a change in skin surface or surface air diurnal temperature range (DTR) under 2 × CO2 and -2% solar forcings. An ensemble of model runs was employed with locations selected to represent a range of different climatic conditions and with forcing implemented hourly throughout the diurnal cycle. The change in skin surface DTR and surface energy fluxes during the 3 days after forcing were used to quantify the rapid adjustment response and temperature related feedback. Averaged over all locations, skin surface DTR reduced by 0.01C after CO2 forcing and included a rapid adjustment to skin surface DTR of -0.12C. Skin surface DTR reduced by 0.17C after solar forcing and included a rapid adjustment of -0.01C. The rapid adjustments in skin surface DTR were associated with rapid adjustments in surface sensible and latent heat fluxes necessary to balance the energy budget immediately after forcing. We find that the sensitivity of skin surface DTR to mean temperature related feedback is the same for CO2 and solar forcings when skin surface DTR rapid adjustments are allowed for. Rapid adjustments played a key role in the geographic variation of the skin surface DTR response to forcing. Our results suggest that diurnal variations in trends of downwelling longwave radiation and rapid reductions in DTR associated with CO2 forcing potentially contributed to the observed global trend in surface air DTR.
On the origin of multidecadal to centennial Greenland temperature anomalies over the past 800 yr
Kobashi et al. 2013 Climate of the Past 9, 583-596
The surface temperature of the Greenland ice sheet is among the most important climate variables for assessing how climate change may impact human societies due to its association with sea level rise. However, the causes of multidecadal-to-centennial temperature changes in Greenland temperatures are not well understood, largely owing to short observational records. To examine these, we calculated the Greenland temperature anomalies (GTA[G-NH]) over the past 800 yr by subtracting the standardized northern hemispheric (NH) temperature from the standardized Greenland temperature. This decomposes the Greenland temperature variation into background climate (NH); polar amplification; and regional variability (GTA[G-NH]). The central Greenland polar amplification factor as expressed by the variance ratio Greenland/NH is 2.6 over the past 161 yr, and 3.3-4.2 over the past 800 yr. The GTA[G-NH] explains 31-35 % of the variation of Greenland temperature in the multidecadal-to-centennial time scale over the past 800 yr. We found that the GTA[G-NH] has been influenced by solar-induced changes in atmospheric circulation patterns such as those produced by the North Atlantic Oscillation/Arctic Oscillation (NAO/AO). Climate modeling and proxy temperature records indicate that the anomaly is also likely linked to solar-paced changes in the Atlantic meridional overturning circulation (AMOC) and associated changes in northward oceanic heat transport.
Solar influence on climate variability and human development during the Neolithic: evidence from a high-resolution multi-proxy record from Templevanny Lough, County Sligo, Ireland
Stolze et al. 2013 Quaternary Science Reviews 67, 138-159
The relationship between climatic variations, vegetation dynamics and early human activity between c. 4150-2860 BC was reconstructed from a high-resolution pollen and geochemical record obtained from a small lake located in County Sligo, Ireland. The proxy record suggests the existence of a woodland with a largely closed canopy at the start of the fourth millennium BC. Only minor human disturbance is recorded. Following an episode of increased rainfall at c. 3990 BC, a decrease in the elm population occurred between c. 3970 and 3820 BC. This coincided with a period of warming and drying climatic conditions and an initial increase in anthropogenic activities. A second episode of high precipitation between c. 3830-3800 BC was followed by a steep increase in human impact on the landscape, which became most pronounced between c. 3740 and 3630 BC. At this time, the lake level of Templevanny Lough was at its lowest during the Neolithic. The onset of wetter and cooler conditions after c. 3670 BC, representing the transition from the Early to the Middle Neolithic, coincided with a period of woodland recovery. The Middle Neolithic was characterised by pronounced climatic oscillations including periods of substantial rainfall between c. 3600 and 3500 BC and between c. 3500 and 3460 BC. A nearly century-long climatic amelioration between c. 3460-3370 BC facilitated a revival of human activity on a small scale around the lake. Abandonment of the area and full woodland recovery occurred after a period of particularly wet and cool conditions ranging from c. 3360-3290 BC. The pollen and geochemistry data suggest that the Late Neolithic was marked by a period of ameliorated conditions between c. 3110-3050 BC that was followed by two episodes of high rainfall at c. 3060-3030 BC and c. 2940-2900 BC. The timing of the climatic shifts inferred from the Templevanny Lough record is in agreement with those of moisture/precipitation and temperature reconstructions from northern and western Europe and the Alps, suggesting that the studied period was characterised by a high-frequency climate variability. The results of the present study imply that human development during the Irish Neolithic was influenced by climatic variations. These climatic shifts correspond to variations in solar activity, suggesting a solar forcing on climate.
Geomagnetic field variations in Western Europe from 1500BC to 200 AD. Part II: new intensity secular variation curve
Hervé et al. in press Physics of the Earth and Planetary Interiors
In order to extend the secular variation curve (SVC) of archaeointensity in Western Europe to the first millennium BC, we studied 24 kilns and hearths in place, 2 displaced hearths and 6 sets of pottery sherds from French archaeological sites. Archaeological artefacts, radiocarbon and dendrochronology dated the acquisition of the thermoremanent magnetization (TRM) carried by the studied objects. Rock magnetism experiments suggest that the main carrier of the magnetization is a Ti-poor titanomagnetite. Archaeointensity was determined by the Thellier-Thellier classical protocol with pTRM-checks. A strict criteria set was applied to select only the most reliable results with linear NRM-TRM diagrams (55% of total specimens). This study demonstrates that pottery sherds with two TRMs give reliable archaeointensities in the low-temperature interval, if the NRM-TRM diagram is adequately adjusted. Eighteen new mean archaeointensities (14 corrected from the anisotropy of TRM and 16 from cooling rate) were computed. The comparison with previously published Western Europe paleointensities show a strong dispersion between data primarily due to their variable quality. Western Europe data were weighted following the archaeointensity protocol, the number of specimens per site and the type of studied materials, in order to better highlight the secular variation of archaeointensity during the first millennium BC. The SVC, built with sliding windows of 160 years shifted every 50 years, presents (at Paris) a maximum of 90uT around 800BC and a minimum of 60uT around 250BC. These archaeointensity maximum and minimum correspond to cusps of the geomagnetic field direction in Western Europe. This new curve is consistent with Mesopotamian and Eastern Europe data. The archaeointensity secular variation in Western Europe predicted by global geomagnetic models CALS3k.4, ARCH3k.1 and ARCH3k_cst.1 is smoother than our SVC. We used our directional dataset (Hervé et al., 2012a) to build a new Western Europe VGPs and VDMs mean curves. Comparison with the predictions given by the global models points out a possible persistent non-dipole fields effect over Europe between 1000BC and 600-500BC. Finally, we note that the strong variations of intensity of the geomagnetic field (with a mean decrease rate per century close to 6uT) will be useful for archaeomagnetic dating purposes.
A synthesis of the Antarctic surface mass balance during the last 800 yr
Frezotti et al. 2013 The Cryosphere 7, 303-319
Global climate models suggest that Antarctic snowfall should increase in a warming climate and mitigate rises in the sea level. Several processes affect surface mass balance (SMB), introducing large uncertainties in past, present and future ice sheet mass balance. To provide an extended perspective on the past SMB of Antarctica, we used 67 firn/ice core records to reconstruct the temporal variability in the SMB over the past 800 yr and, in greater detail, over the last 200 yr. Our SMB reconstructions indicate that the SMB changes over most of Antarctica are statistically negligible and that the current SMB is not exceptionally high compared to the last 800 yr. High-accumulation periods have occurred in the past, specifically during the 1370s and 1610s. However, a clear increase in accumulation of more than 10 % has occurred in high SMB coastal regions and over the highest part of the East Antarctic ice divide since the 1960s. To explain the differences in behaviour between the coastal/ice divide sites and the rest of Antarctica, we suggest that a higher frequency of blocking anticyclones increases the precipitation at coastal sites, leading to the advection of moist air in the highest areas, whereas blowing snow and/or erosion have significant negative impacts on the SMB at windy sites. Eight hundred years of stacked records of the SMB mimic the total solar irradiance during the 13th and 18th centuries. The link between those two variables is probably indirect and linked to a teleconnection in atmospheric circulation that forces complex feedback between the tropical Pacific and Antarctica via the generation and propagation of a large-scale atmospheric wave train.
Variation of the Schwabe Cycle length during the Grand Solar Minimum in the 4th Century BC deduced from radiocarbon content in tree rings
Nagaya et al. 2012 Solar Physics 280, 223-236
Solar activity alternates between active and quiet phases with an average period of 11 years, and this is known as the Schwabe cycle. Additionally, solar activity occasionally falls into a prolonged quiet phase (grand solar minimum), as represented by the Maunder Minimum in the 17th century, when sunspots were almost absent for 70 years and the length of the Schwabe cycle increased to 14 years. To examine the consistency of the cycle length characteristics during the grand solar minima, the carbon-14 contents in single-year tree rings were measured using an accelerator mass spectrometer as an index of the solar variability during the grand solar minimum of the 4th century BC. The signal of the Schwabe cycle was detected with a statistical confidence level of higher than 95% by wavelet analysis. This is the oldest evidence for the Schwabe cycle at the present time, and the cycle length is considered to have increased to approximately 16 years during the grand solar minimum of the 4th century BC. This result confirms the association between the increase of the Schwabe cycle length and the weakening of solar activity, and indicates the possible prolonged absence of sunspots in the 4th century BC as during the Maunder Minimum. Theoretical implications from solar dynamo theory are discussed in order to identify the trigger of prolonged sunspot absence. A possible association between the long-term solar variation around the 4th century BC and terrestrial cooling in this period is also discussed.
Phytolith records of the climate change since the past 15000 years in the middle reach of the Yangtze River in China
Gu et al. 2012 Frontiers of Earth Science 6, 10-17
Based on 14C dating and core sediments survey, phytolith records are employed to reconstruct paleovegetation and paleoclimate in the Jianghan Plain in the middle reach of the Yangtze River. Phytoliths identified are assigned into 21 well-described morphotypes and divided into four groups (Poaceae, fern, coniferous and broad-leaved). The phytolith assemblages together with warmth index (Iw) are divided into 18 ecological zones, which reflect a complete vegetation history related to climate change in the middle reach of the Yangtze River during the past 15000 years. On the basis of the correlation of phytolith records with the paleoclimatic indicators from stalagmite, peatland, North Atlantic deep-sea sediments, Loess Plateau of Central China, and Arabic Sea sediments, eight climatic phases are identified included Last Glacial Maximum (LGM) (20 - 14.8 cal kaBP), Last Deglaciation (LDG) (14.8 - 11.9 cal kaBP), low-temperature phase in the Early Holocene (11.9 - 8 cal kaBP), Holocene Optimum (8 - 4.9 cal kaBP), Holocene Katathermal (4.9 - 1.1 cal kaBP), Medieval Warmth Period (MWP) (1.1 - 0.7 cal kaBP), Little Ice Age (LIA) (0.7 - 0.15 cal kaBP), and Modern Warming (0.15 cal kaBP - present). Climatic events such as Bolling-Allerod warm intervals, Older Dryas, Inter-Allerod Cold Period, and Younger Dryas, and eight Holocene Bond events (B1-8) have been identified since the LDG. Our results demonstrate that the evolution of the climate in the research area has a strong link with the Indian Summer Monsoon (SW Monsoon), Asian Summer Monsoon (SE Monsoon), and Holocene events in North Atlantic simultaneously, which might indicate that solar variability affects the Earth surface climate system at the centennial and millennial scales.
A possible solar pacemaker for Holocene fluctuations of a salt-marsh in southern Italy
Di Rita 2013 Quaternary International 288, 239-248
This study is aimed at verifying the possible influence of solar activity on the coastal vegetation development in the Tavoliere Plain (south Adriatic region, Italy) between 6350 and 4000 cal BP, when regular fluctuations of halophilic vegetation are recorded by pollen. A wavelet analysis, applied to the percentage values of glasswort vegetation is consistent with periodicities of solar activity and other palaeoenvironmental and palaeoclimate proxies in the literature. A comparison of salt-marsh pollen indicators (Salicornia type and Ruppia maritima) with the 10Be dataset from the Greenland ice core GISP2, on the basis of their independent chronologies, reveals a strong visual correlation, indicating that the minima of salt-marsh percentages match minima in the 10Be curve, corresponding to solar activity maxima, associated with warm and arid phases at the middle latitudes. The Tavoliere salt-marsh appears to have contracted during the arid/warm phases associated to maxima of solar activity and to have expanded during the wet/cold phases of solar minima. This coastal area, characterized by a very flat topography and arid climate, appears to have been very sensitive to even minor hydrological and climate changes. Changes of solar activity, determining extensive environmental transformations, were also possibly responsible for the abandonment of the human coastal settlements of one of the most important Neolithic archaeological districts of Italy.
Influence of the Pacific Decadal Oscillation, El Nino-Southern Oscillation and solar forcing on climate and primary productivity changes in the northeast Pacific
Patterson et al. in press Quaternary International
Evidence of 11-year Schwabe solar sunspot cycles, El Niño-Southern Oscillation (ENSO) and the Pacific Decadal Oscillation (PDO) were detected in an annual record of diatomaceous laminated sediments from anoxic Effingham Inlet, Vancouver Island, British Columbia. Radiometric dating and counting of annual varves dates the sediments from AD 1947-1993. Intact sediment slabs were X-rayed for sediment structure (lamina thickness and composition based on gray scale), and subsamples were examined for diatom abundances and for grain size. Wavelet analysis reveals the presence of c. 2-3, c. 4.5, c. 7 and c. 9-12-year cycles in the diatom record and an c. 11-13 year record in the sedimentary varve thickness record. These cycle lengths suggest that both ENSO and the sunspot cycle had an influence on primary productivity and sedimentation patterns. Sediment grain size could not be correlated to the sunspot cycle although a peak in the grain size data centered around the mid-1970s may be related to the 1976-1977 Pacific climate shift, which occurred when the PDO index shifted from negative (cool conditions) to positive (warm conditions). Additional evidence of the PDO regime shift is found in wavelet and cross wavelet results for Skeletonema costatum, a weakly silicified variant of S. costatum, annual precipitation and April to June precipitation. Higher spring (April/May) values of the North Pacific High pressure index during sunspot minima suggest that during this time, increased cloud cover and concomitant suppression of the Aleutian Low (AL) pressure system led to strengthened coastal upwelling and enhanced diatom production earlier in the year. These results suggest that the 11-year solar cycle, amplified by cloud cover and upwelling changes, as well as ENSO, exert significant influence on marine primary productivity in the northeast Pacific. The expression of these cyclic phenomena in the sedimentary record were in turn modulated by the phase of PDO, as indicated by the change in period of ENSO and suppression of the solar signal in the record after the 1976-1977 regime shift.
A study on possible solar and geomagnetic effects on the precipitation over Northwestern Argentina
Heredia and Elias 2013 Advances in Space Research
The precipitation over Tucuman (26.8 S; 65.2 W), which is representative of the Northwestern region of Argentina, is analyzed in search of an association with solar and geomagnetic activity, with the purpose of contributing to the controversial issue on the connection between climate variation and anthropogenic vs. natural forcing. Monthly time series of precipitation, sunspot number (Rz), and aa index were used for the period 1884-2010. A wavelet analysis was performed first which, due to the time series length, shows significant results only for periodicities lower than 32 years. Due to the transient character and non-constant phase of the results, any sustained wavelet coherence between precipitation and either sunspots or aa could be noticed. Moving averages and correlations were also assessed. The 11 and 22-year running mean of precipitation is positively correlated to Rz and aa when the whole period of analysis is considered. However, a shift in the long-term behavior of precipitation is noticed around 1940, which implies different correlation values with Rz and aa when the period before or after this year are considered. The solar cycle length is also considered for this statistical study and partly confirms the results obtained with Rz and aa. We propose plausible physical explanations based on geomagnetic activity and total solar irradiance effects over atmospheric circulation that could support the statistical result. A deeper analysis and broader geographical coverage is needed in order to detect a connection between precipitation and solar variability discernible from greenhouse gases effects. We emphasize the idea of the importance of recognizing and quantifying the different forcing acting on precipitation (or any other climate parameter), which sometimes can be barely evident from a solely statistical analysis.
The planetary hypothesis revived
Charbonneau 2013 Nature 493, 613-614
The Sun's magnetic activity varies cyclically over a period of about 11 years. An analysis of a new, temporally extended proxy record of this activity hints at a possible planetary influence on the amplitude of the cycle.
Using data to attribute episodes of warming and cooling in instrumental records
Tung and Zhou 2013 PNAS
The observed global-warming rate has been nonuniform, and the cause of each episode of slowing in the expected warming rate is the subject of intense debate. To explain this, nonrecurrent events have commonly been invoked for each episode separately. After reviewing evidence in both the latest global data (HadCRUT4) and the longest instrumental record, Central England Temperature, a revised picture is emerging that gives a consistent attribution for each multidecadal episode of warming and cooling in recent history, and suggests that the anthropogenic global warming trends might have been overestimated by a factor of two in the second half of the 20th century. A recurrent multidecadal oscillation is found to extend to the preindustrial era in the 353-y Central England Temperature and is likely an internal variability related to the Atlantic Multidecadal Oscillation (AMO), possibly caused by the thermohaline circulation variability. The perspective of a long record helps in quantifying the contribution from internal variability, especially one with a period so long that it is often confused with secular trends in shorter records. Solar contribution is found to be minimal for the second half of the 20th century and less than 10% for the first half. The underlying net anthropogenic warming rate in the industrial era is found to have been steady since 1910 at 0.07-0.08 C/decade, with superimposed AMO-related ups and downs that included the early 20th century warming, the cooling of the 1960s and 1970s, the accelerated warming of the 1980s and 1990s, and the recent slowing of the warming rates. Quantitatively, the recurrent multidecadal internal variability, often underestimated in attribution studies, accounts for 40% of the observed recent 50-y warming trend.
High-resolution analysis of upper Miocene lake deposits: Evidence for the influence of Gleissberg-band solar forcing
Kern et al. 2013 Palaeogeography, Palaeoclimatology, Palaeoecology 370, 167-183
A high-resolution multi-proxy analysis was conducted on a 1.5-m-long core of Tortonian age (~ 10.5 Ma; Late Miocene) from Austria (Europe). The lake sediments were studied with a 1-cm resolution to detect all small-scale variations based on palynomorphs (pollen and dinoflagellate cysts), ostracod abundance, geochemistry (carbon and sulfur) and geophysics (magnetic susceptibility and natural gamma radiation). Based on an already established age model for a longer interval of the same core, this sequence can be limited to approx. two millennia of Late Miocene time with a resolution of ~ 13.7 years per sample. The previous study documented the presence of solar forcing, which was verified within various proxies on this 1.5-m core by a combination of REDFIT spectra and Gaussian filters. Significant repetitive signals ranged in two discrete intervals corresponding roughly to 55-82 and 110-123 years, fitting well within the lower and upper Gleissberg cycle ranges. Based on these results, the environmental changes along the 2000-year Late Miocene sequence are discussed. No major ecological turnovers are expected in this very short interval. Nonetheless, even within this brief time span, dinoflagellates document rapid changes between oligotrophic and eutrophic conditions, which are frequently coupled with lake stratification and dysoxic bottom waters. These phases prevented ostracods and molluscs from settling and promoted the activity of sulfur bacteria. The pollen record indicates rather stable wetland vegetation with a forested hinterland. Shifts in the pollen spectra can be mainly attributed to variations in transport mechanisms. These are represented by a few phases of fluvial input but mainly by changes in wind intensity and probably also wind direction. Such influence is most likely caused by solar cycles, leading to a change in source area for the input into the lake. Furthermore, these solar-induced variations seem to be modulated by longer solar cycles. The filtered data display comparable patterns and modulations, which seem to be forced by the 1000-year and 1500-year cycles. The 1000-year cycle modulated especially the lake surface proxies, whereas the 1500-year cycle is mainly reflected in hinterland proxies, indicating strong influence on transport mechanisms.
Paleoclimate of the Southern Adriatic Sea region during the 'Medieval Climate Anomaly' reflected by organic walled dinoflagellate cysts
Chen et al. 2013 The Holocene
To obtain insight into the character and forcing of southern Italian climate change during the 'Medieval Climate Anomaly' (c. AD 900-1200), marine sediments deposited between AD 990 and 1200 from the Gulf of Taranto have been analyzed for their dinoflagellate cyst content with a 3.5 yr resolution. The reconstructed sea surface temperature (SST) appears to be lower than today. We observe a clear 11.4 yr cyclicity in the reconstructed SST series. Furthermore, there is a good matching between SST and global 14C anomalies. This suggests that solar activity might have had an important influence on the local climate during Medieval time. Short-term fluctuations in accumulation rates of aerobic degradation resistant species that react sensitively on the trophic state of the upper waters and/or are characteristic for river plume waters indicate that the trophic state of the upper waters is closely linked to river discharge, which in turn is strongly related to precipitation in Italy. We reconstruct low river discharge/precipitations in the Adriatic area synchronous to widespread drought events in other nearby subtropical regions. We attribute this to NAO and ENSO related large-scale ocean-atmosphere circulation shifts during the Medieval period. Furthermore, we suggest that eruptions of southern Italian volcanoes might have influenced the local upper water nutrient conditions as well.
Influence of solar activity on breaching, overflowing and course-shifting events of the Lower Yellow River in the late Holocene
Wang & Su 2013 The Holocene
The Lower Yellow River (LYR) has been characterized as a frequently breaching, overflowing and shifting river in historical periods. Understanding the factors that influence the LYR variations is critical for river management and disaster prevention. This study constructed a spatio-temporal data base of the LYR's breaching and overflowing events (BOEs) and course-shifting events (CSEs) occurring in the late Holocene. The data base and corresponding solar activity data were analyzed to determine the overall influence, temporal influence and spatial influence of solar activity on the LYR. Results showed that 75.5% of the LYR CSEs and 61.7% of the LYR BOEs occurred in sunspot number decline phases of 11 yr solar cycles, suggesting that the LYR changed more frequently during the sunspot number decline phases. The underlying mechanism of this phenomenon was further interpreted as the high correlation between sunspot decline phases and heavy rainfall in the middle reaches of Yellow River (MYR). Five of the six heavy rainfall years over the last 60 years and 14 of the 16 well-known heavy rainfall records from 132 BC to AD 1933 in the MYR occurred in sunspot decline phases. Heavy rainfall in the MYR promoted the increase of the LYR runoff and the sediment rate and then raised the possibility of the occurrence of BOEs and CSEs. The study also found that the frequency of BOEs was positively related to the fluctuation amplitude of the sunspot maximum intensity in long time series. The flow directions of the LYR courses were found to affect the influence of solar activity on BOEs. The highest correlation between sunspot decline phases and BOEs was presented during the lifetime of eastward flows while the lowest during the lifetime of northward flows. In addition, human activities may undermine the impact of solar activities on the LYR changes.
Are the sunspots really vanishing? Anomalies in solar cycle 23 and implications for long-term models and proxies
Clete and Lefevre 2012 J. Space Weather Space Clim. 2 A06
Context: The elapsed solar cycle (23) ended with an exceptionally long period of low activity and with unprecedented low levels for various series of solar irradiance and particle flux measurements. This unpredicted evolution of solar activity raised multiple questions about a future decline of the solar cycles and launched a quest for precursor signs of this possible deep solar transition over the last decade. Aim: We present here a review and overall interpretation of most current diagnostics of solar cycle 23, including the recent disagreements that appeared among solar reference indices and standard solar-based geo-indices, the indication of a changed pattern of internal torsional waves (helioseismology) or the announced fading and magnetic weakening of sunspots. Methods: Based on a statistical analysis of detailed sunspot properties over the last 24 years, we complete the picture with new evidence of a strong global deficit of the smallest sunspots starting around 2000, in order to answer the question: are all sunspots about to disappear? Results: This global scale-dependent change in sunspot properties is confirmed to be real and not due to uncontrolled biases in some of the indices. It can also explain the recent discrepancies between solar indices by their different sensitivities to small and weak magnetic elements (small spots). The International Sunspot Index Ri, based on unweighted sunspot counts, proved to be particularly sensitive to this particular small-scale solar evolution. Conclusions: Our results and interpretation show the necessity to look backwards in time, more than 80 years ago. Indeed, the Sun seems to be actually returning to a past and hardly explored activity regime ending before the 1955-1995 Grand Maximum, which probably biased our current space-age view of solar activity.
Influence of orbital forcing and solar activity on water isotopes in precipitation during the mid- and late Holocene
Dietrich et al. 2013 Climate of the Past 9, 13-26
In this study we investigate the impact of mid- and late Holocene orbital forcing and solar activity on variations of the oxygen isotopic composition in precipitation. The investigation is motivated by a recently published speleothem d18O record from the well-monitored Bunker Cave in Germany. The record reveals some high variability on multi-centennial to millennial scales that does not linearly correspond to orbital forcing. Our model study is based on a set of novel climate simulations performed with the atmosphere general circulation model ECHAM5-wiso enhanced by explicit water isotope diagnostics. From the performed model experiments, we derive the following major results: (1) the response of both orbital and solar forcing lead to changes in surface temperatures and d18O in precipitation with similar magnitudes during the mid- and late Holocene. (2) Past d18O anomalies correspond to changing temperatures in the orbital driven simulations. This does not hold true if an additional solar forcing is added. (3) Two orbital driven mid-Holocene experiments, simulating the mean climate state approximately 5000 and 6000 yr ago, yield very similar results. However, if an identical additional solar activity-induced forcing is added, the simulated changes of surface temperatures as well as d18O between both periods differ. We conclude from our simulation results that non-linear effects and feedbacks of the orbital and solar activity forcing substantially alter the d18O in precipitation pattern and its relation to temperature change.
Summed radiocarbon probability density functions cannot prove solar forcing of Central European lake-level changes
Bleicher, 2013 The Holocene
It has been argued that Central European lake levels were driven by solar activity. This interpretation rests on the comparison of a score record of radiocarbon dates with the 14C residual curve. This score record is a variant of a cumulative probability density function (CPF). In this paper it is argued that this method is not valid because the shape of the CPF is determined by the calibration curve. This hypothesis is tested by a set of null models. An alternative interpretation is given according to which only few episodes of Holocene lake-level changes were climatically driven, while most of the time non-climatic factors were dominating. On a more general level some methodological issues of CPFs are discussed and exemplified by the comparison of dendrochronological results from archaeological settlements and a CPF created using radiocarbon dates from the same settlements.
A Mechanism for Lagged North Atlantic Climate Response to Solar Variability
Scaife et al. 2013 Geophysical Research Letters, in press
Variability in solar irradiance has been connected to changes in surface climate in the North Atlantic through both observational and climate modelling studies which suggest a response in the atmospheric circulation that resembles the North Atlantic Oscillation or its hemispheric equivalent the Arctic Oscillation. It has also been noted that this response appears to follow the changes in solar irradiance by a few years, depending on the exact indicator of solar variability. Here we propose and test a mechanism for this lag based on the known impact of atmospheric circulation on the Atlantic Ocean, the extended memory of ocean heat content anomalies and their subsequent feedback onto the atmosphere. We use results from climate model experiments to develop a simple model for the relationship between solar variability and North Atlantic climate.
Circulation changes in the winter lower atmosphere and long-lasting solar/geomagnetic activity
Bochnicek et al. 2012 Ann. Geophys. 30, 1719-1726
The paper describes the association between high long-lasting solar/geomagnetic activity and geopotential height (GPH) changes in the winter lower atmosphere, based on their development in the Northern Hemisphere in the winter periods (December-March) of 1950-1969 and 1970-2002. Solar/geomagnetic activity is characterised by the 60-day mean of the sunspot number R/by the 60-day mean of the daily sum of the Kp index. The GPH distributions in the lower atmosphere are described by 60-day anomalies from their long-term daily average at 20 hPa/850 hPa. The data have been adopted from the NCEP/NCAR reanalysis. The 60-day mean values of solar/geomagnetic activity and GPH anomalies were calculated in five-day steps over the whole winter period. The analysis was carried out using composite maps which represent their distribution of the GPH anomalies during high solar activity (R > 100) and high geomagnetic activity ( Kp > 20). Analysis has shown that the dis- tribution of GPH anomalies depends on solar activity, geo-magnetic activity and the phase of winter period (early or late winter). The nature of this relationship then depends on the time interval involved, i.e. 1950-1969 or 1970-2002. Positive anomalies in the polar stratosphere (20 hPa) were detected during the whole winter periods of the years 1950-1969. Significant anomalies were detected in the lower tropo- sphere (850 hPa) during the second half of the winter period. The distribution of GPH anomalies on the maps compiled with regard to solar activity was similar to the distribution on maps compiled with regard to geomagnetic activity. In the interval 1970-2002, significant negative GPH anomalies were detected in the stratosphere at high latitudes, and positive anomalies were detected in the region of low latitudes. The distribution of GPH anomalies in the lower troposphere was substantially affected by situations in which, together with high solar activity, also high geomagnetic activity occurred.
Orbital and solar forcing of shifts in Mid- to Late Holocene flood intensity from varved sediments of pre-alpine Lake Ammersee (southern Germany)
Czymzik et al. 2013 Quaternary Science Reviews 61, 96-110
Microfacies analyses and X-ray fluorescence scanning (u-XRF) at sub-mm resolution were conducted on the varved Mid- to Late Holocene interval of two sediment profiles from pre-alpine Lake Ammersee (southern Germany). The coring sites are located in a proximal (AS10prox) and distal (AS10dist) position towards the main tributary River Ammer, in 1.8 km distance from each other. To shed light on sediment distribution within the lake, particular emphasis was (1) the detection of intercalated detrital layers and their micro-sedimentological features, and (2) intra-basin correlation of these event deposits. Detrital layers were dated by microscopic varve counting, verified by accelerator mass spectrometry 14C dating of terrestrial plant macrofossils. Since c. 5500 varve years (vyr) BP, in total 1573 detrital layers were detected in either one or both of the investigated sediment profiles. Based on their microfacies, geochemistry, and proximal-distal deposition pattern, detrital layers were interpreted as River Ammer flood deposits. Earlier studies on flood layer seasonality have proven that flood layer deposition occurs predominantly during spring and summer, the flood season at Lake Ammersee. Most prominent features of the record are the onset of regular flood layer deposition at c. 5500 vyr BP in AS10prox and c. 2800 vyr BP in AS10dist as well as three major increases in mean flood layer thickness at c. 5500, 2800, and 400 vyr BP. Integrating information from both sediment profiles allowed to interpret these changes in terms of shifts towards higher mean flood intensity. Proposed triggering mechanisms are gradual reduction in Northern Hemisphere orbital summer forcing and superimposed centennial-scale solar activity minima. Likely responses to this forcing are enhanced equator-to-pole temperature gradients and changes in synoptic-scale atmospheric circulation. The consequences for the Ammersee region are more intense cyclones leading to extremer rainfall and flood events in spring and summer.
The increase in DLWR was due to the warmer troposphere during the El Nino. Warmer air emits more longwave radiation. The higher concentration of CO2 will also emit more DLWR radiation, but that is not due to increased absorption. I don’t know how scientists can get any more clueless than that.

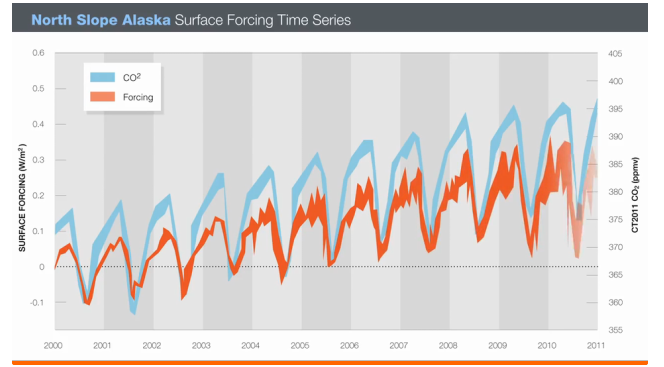


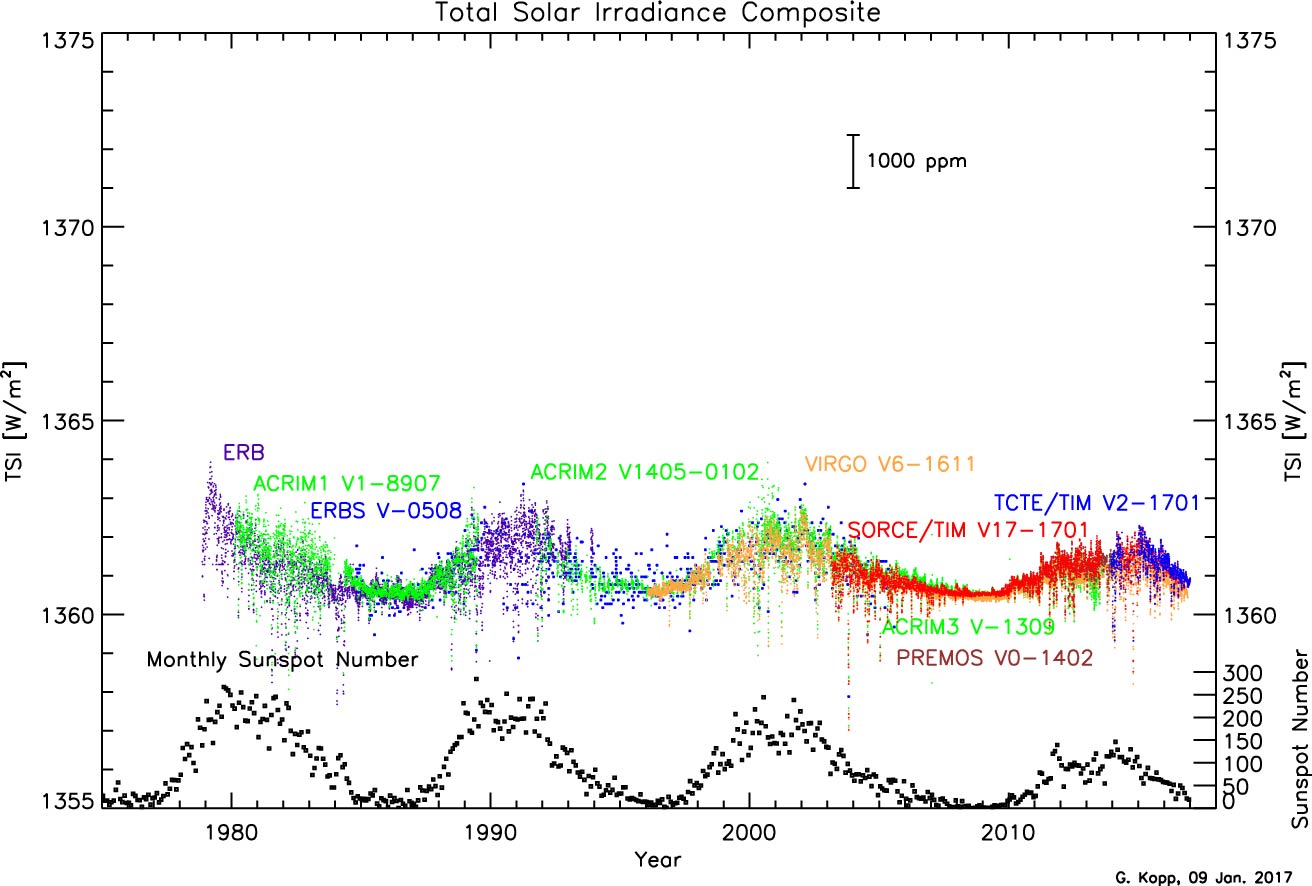